Carrier New Business & Underwriting Analytics
Filter

Filtering the Dashboard
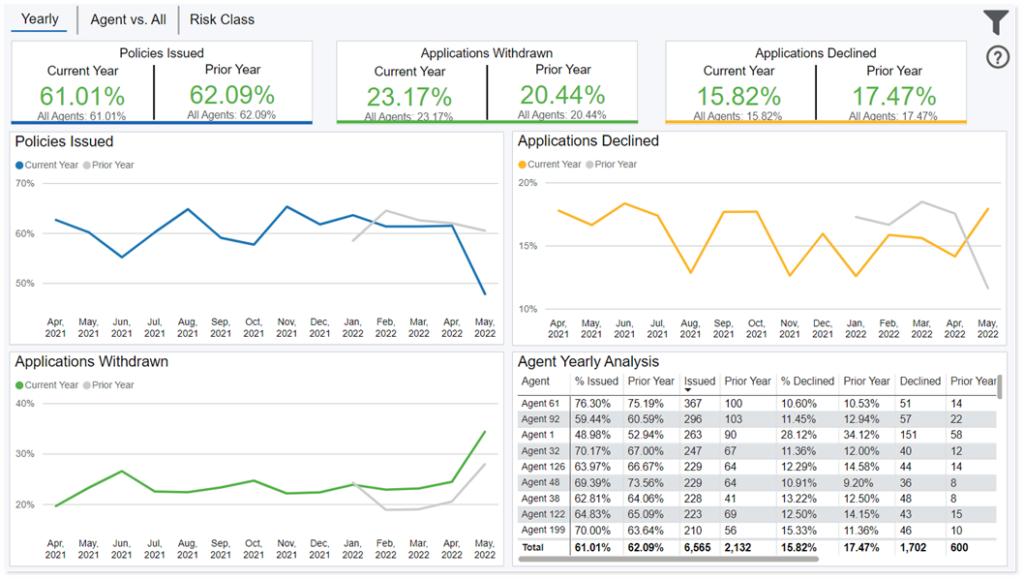
High Level Performance

Overview
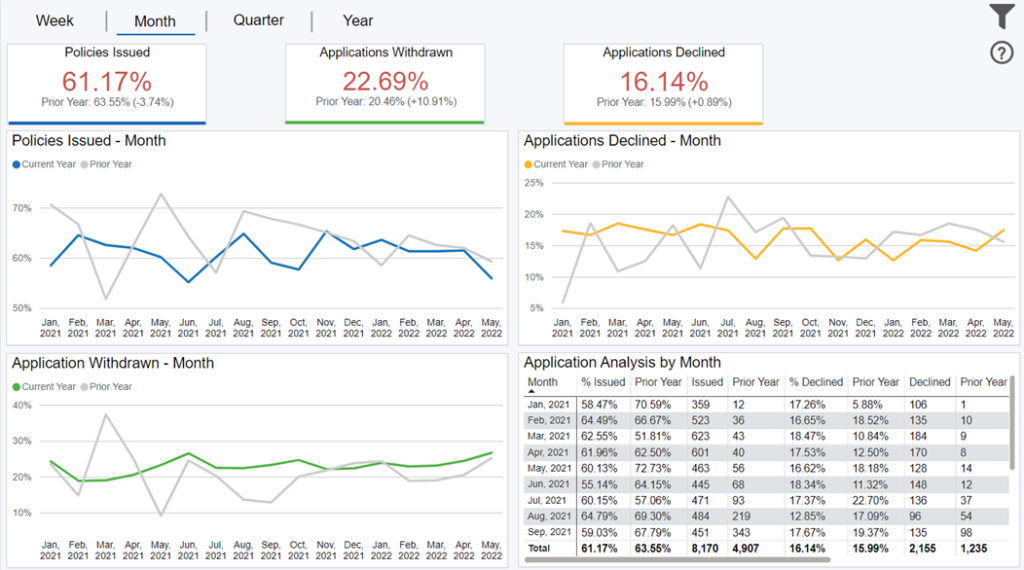
This dashboard displays your performance across various metrics, in total, and over time, including policies issued, applications received, declined, and withdrawn. You can change the time dimension (i.e. x axis) by selecting “Week”, “Month”, “Quarter”, “Year” buttons in the top left and is defaulted to “Month”.
Data Definitions
Policies Issued = number of policies issued (final action of Issued) based on the submit for issue date.
Applications Received = number of applications submitted based on submission date, regardless of final action.
Applications Withdrawn = number of withdrawn cases (final action of withdrawn) based on the submit for issue date.
Applications Declined = number of declined cases (final action of declined) based on the submit for issue date.
Prior Year = the same time period selected in the date filter, but back 1 year.
Filtering the Dashboard
Choose the Filter icon in the top right of the dashboard to narrow down by face amount, product, distribution channel, underwriting risk class, and more.
*Note: The date filter uses the submit for issue date for issued, withdrawn, and declined case activity. For applications received, the date filter goes off the submission date.
Case Details Drilldown
Right click any point on the trend lines and select “Drill through > Case Detail Drilldown” to get your underlying case details.
Fastest Changing Metrics Drilldown
Right click any point on the trend lines and select “Drill through > FCM Drill through” to get details behind what changed most in your organization versus the prior period.
Exporting Data
Click the “Quick Actions” dropdown in the top right of your screen to send this information to your email. Choosing “Export” will immediately send an email with a file attachment. This email is tied to your InsureSight username.
Choosing “Schedule” will allow you to set up a recurring email to be delivered on the schedule you choose. To modify this schedule, click the “Settings” option in the far-left navigation menu under “InsureSight.”
Underwriting Percentage Ratios
Overview
This dashboard displays your performance across various ratio metrics, in total, and over time, including policies issued, declined, and withdrawn. You can change the time dimension (i.e. x axis) by selecting “Week”, “Month”, “Quarter”, “Year” buttons in the top left and is defaulted to “Month”.
Data Definitions
Policies Issued Ratio = sum of Issued policies divided by sum of Issued, Withdrawn, or Declined cases; this is the same as placement ratio and based on submit for issue date.
Applications Withdrawn Ratio = sum of Withdrawn cases divided by sum of Issued, Withdrawn, or Declined cases; this is the same as placement ratio and based on submit for issue date.
Applications Declined Ratio = sum of Declined cases divided by sum of Issued, Withdrawn, or Declined cases; this is the same as placement ratio and based on submit for issue date.
Prior Year = the same time period selected in the date filter, but back 1 year.
Filtering the Dashboard
Choose the Filter icon in the top right of the dashboard to narrow down by face amount, product, distribution channel, underwriting risk class, and more.
*Note: The date filter uses the submit for issue date for issued, withdrawn, and declined case activity. For applications received, the date filter goes off the submission date.
Case Details Drilldown
Right click any point on the trend lines and select “Drill through > Case Detail Drilldown” to get your underlying case details.
Fastest Changing Metrics Drilldown
Right click any point on the trend lines and select “Drill through > FCM Drill through” to get details behind what changed most in your organization versus the prior period.
Exporting Data
Click the “Quick Actions” dropdown in the top right of your screen to send this information to your email. Choosing “Export” will immediately send an email with a file attachment. This email is tied to your InsureSight username.
Choosing “Schedule” will allow you to set up a recurring email to be delivered on the schedule you choose. To modify this schedule, click the “Settings” option in the far-left navigation menu under “InsureSight.”
Pending Analysis
Overview
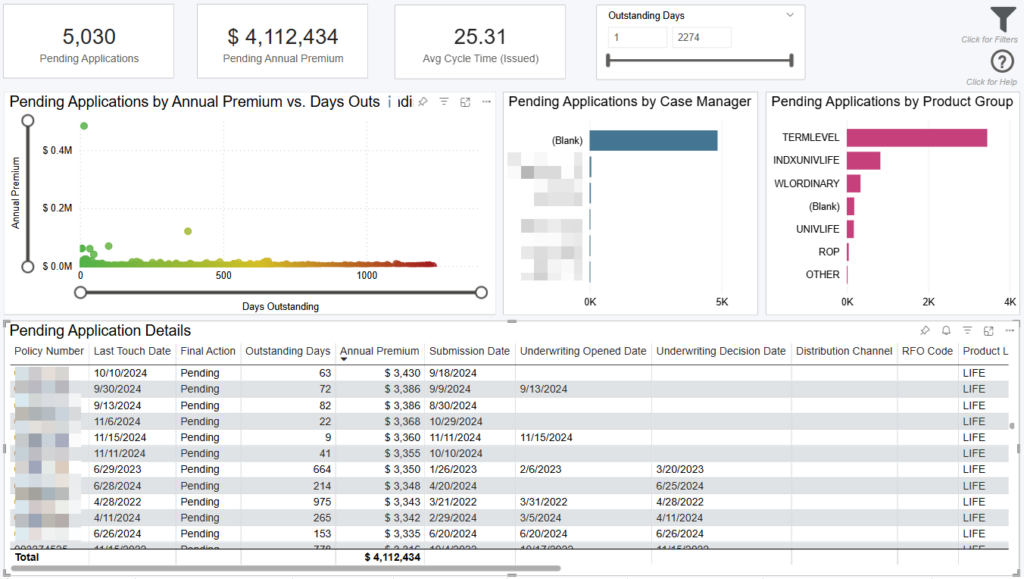
This dashboard displays your applications currently pending and which case managers and products are responsible. Use the Outstanding Days filter directly on the dashboard to segment your pending pipeline and see details of applications that are getting “stuck”.
The Pending Apps by Days table displays details on each outstanding app such as agent, case manager, outstanding days, annual premium, & relative application dates.
To see full application details, right click any point and select “Drill through > Application Detail Drilldown” to get your underlying application details.
Data Definitions
Outstanding Days = days between the app submission date to today.
Applications Pending = number of applications pending (final action of Pending) based on the submission date.
Touches = is an action made by a user that makes a change to data within Resonant. Note: all touches belong to a session and made by just one user.
Filtering the Dashboard
Choose the Filter icon in the top right of the dashboard to narrow down by face amount, product, distribution channel, underwriting risk class, and more.
*Note: The date filter uses the submit for issue date for issued, withdrawn, and declined case activity. For applications pending & received, the date filter goes off the submission date.
Case Details Drilldown
Right click any point on the visuals and select “Drill through > Case Detail Drilldown” to get your underlying case details.
Exporting Data
Click the “Quick Actions” dropdown in the top right of your screen to send this information to your email. Choosing “Export” will immediately send an email with a file attachment. This email is tied to your InsureSight username.
Choosing “Schedule” will allow you to set up a recurring email to be delivered on the schedule you choose. To modify this schedule, click the “Settings” option in the far-left navigation menu under “InsureSight.”
Health Class Insights

Overview
This dashboard displays your risk class performance by applied for type. By default, dashboard displays all final actions but by clicking final action(s) filter in the top left corner of the dashboard, you can run a more targeted analysis.
The 100% stacked column chart displays your total application % in a specific approved risk class. This percentage is split by applications “Approved As Applied For”, “Approved Better Than Applied For”, & “Approved Worse Than Applied For”.
For example, if you have an approved risk class of Standard Non-Tobacco and you have 20% of applications in this approved risk class as Approved As Applied For, 5% Approved Better Than Applied For, and 75% Approved Worse Than Applied For, you can tell applicants are more frequently getting approved for this risk class worse than they applied for. This raises questions for your business like how much premium is lost due to approving worse than applied for? This can be analyzed by filtering final action for withdrawn & declined in the top left corner of the dashboard.
In addition, the table below the 100% stacked column chart displays the same information. On the left-hand side of the screen, the cards display total annual premium by Applied For Type. Below, the donut chart displays overall percent breakdown of applications and their applied for types.
Data Definitions
Approved As Applied For = applications where the approved risk class is the same as the applied risk class.
Approved Better Than Applied For = applications where the approved risk class is better than the applied risk class.
Approved Worse Than Applied For = applications where the approved risk class is worse than the applied risk class.
Policies Issued = number of policies issued (final action of Issued) based on the submit for issue date.
Applications Withdrawn = number of withdrawn cases (final action of withdrawn) based on the submit for issue date.
Applications Declined = number of declined cases (final action of declined) based on the submit for issue date.
Filtering the Dashboard
Choose the Filter icon in the top right of the dashboard to narrow down by face amount, product, distribution channel, underwriting risk class, and more.
*Note: The date filter uses the submit for issue date for issued, withdrawn, and declined case activity. For applications received, the date filter goes off the submission date.
Case Details Drilldown
Right click any point on the trend lines and select “Drill through > Case Detail Drilldown” to get your underlying case details.
Exporting Data
Click the “Quick Actions” dropdown in the top right of your screen to send this information to your email. Choosing “Export” will immediately send an email with a file attachment. This email is tied to your InsureSight username.
Choosing “Schedule” will allow you to set up a recurring email to be delivered on the schedule you choose. To modify this schedule, click the “Settings” option in the far-left navigation menu under “InsureSight.”
Risk Class Comparison
Overview
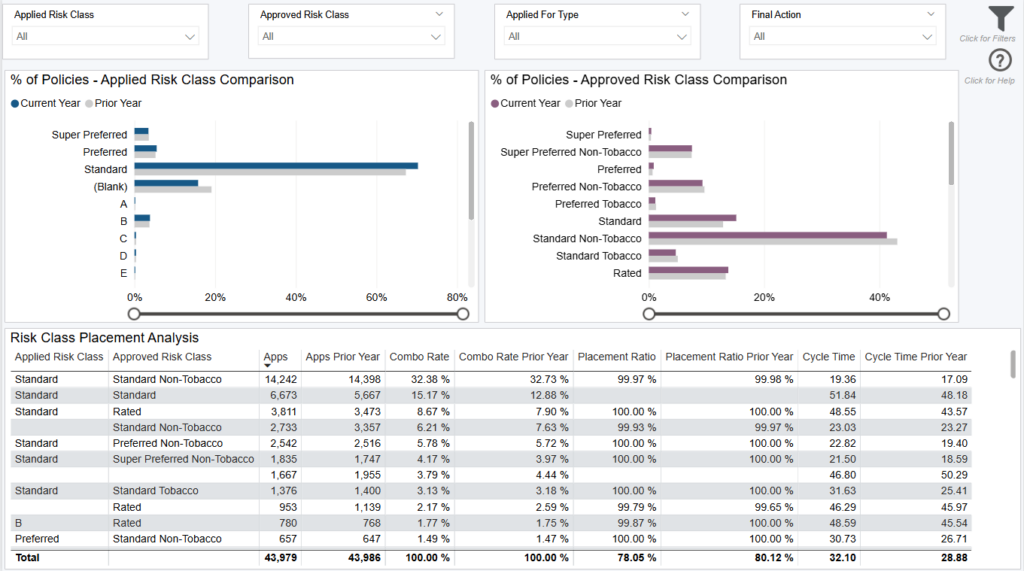
This dashboard allows you to analyze how placement ratios and cycle times vary across different combinations of approved and applied risk class comparisons for both your applications current year vs. prior year.
Data Definitions
Combo Rate = total application percentage of applied and approved risk class combinations.
Cycle Time = days between submission date and submit for issue date.
Placement Ratio = number of issued cases divided by number of Issued, Declined, and Withdrawn cases.
Policies Issued = number of policies issued (final action of Issued) based on the submit for issue date.
Applications Withdrawn = number of withdrawn cases (final action of withdrawn) based on the submit for issue date.
Applications Declined = number of declined cases (final action of declined) based on the submit for issue date.
Prior Year = the same time period selected in the date filter, but back 1 year.
Filtering the Dashboard
Choose the Filter icon in the top right of the dashboard to narrow down by face amount, product, distribution channel, underwriting risk class, and more.
*Note: The date filter uses the submit for issue date for issued, withdrawn, and declined case activity. For applications received, the date filter goes off the submission date.
Case Details Drilldown
Right click any point on the trend lines and select “Drill through > Case Detail Drilldown” to get your underlying case details.
Exporting Data
Click the “Quick Actions” dropdown in the top right of your screen to send this information to your email. Choosing “Export” will immediately send an email with a file attachment. This email is tied to your InsureSight username.
Choosing “Schedule” will allow you to set up a recurring email to be delivered on the schedule you choose. To modify this schedule, click the “Settings” option in the far-left navigation menu under “InsureSight.”
Role Based Benchmarking
Overview
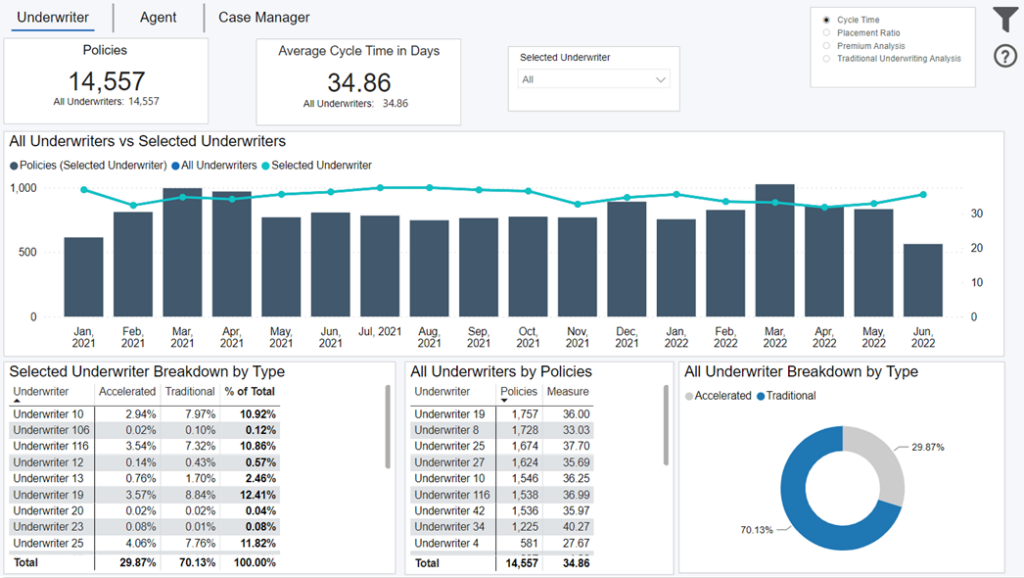
This dashboard compares all of your underwriters, agents, or case managers against the selected filter on-screen. Change comparison calculation by selecting:”Cycle Time”, “e-App Ratio”, “Placement Ratio”, “Premium Analysis”, or underwriting type in the top right corner.
Click the “Underwriter”, “Agent” or “Case Manager” button in the top left to change role for analysis.
*Note: e-App Ratio is only a selection on the Agent tab and dashboard resets to default after clicking “Underwriter”, “Agent”, “Case Manager” buttons in top left.
Data Definitions
Cycle Time = days between submission date and submit for issue date.
Placement Ratio = number of issued cases divided by number of Issued, Declined, and Withdrawn cases.
Underwriting Analysis = number of cases in that type divided by number of all cases.
e-App Ratio = number of cases with electronic application divided by number of all cases.
Premium Analysis = annual premium amount.
Filtering the Dashboard
Choose the Filter icon in the top right of the dashboard to narrow down by face amount, product, distribution channel, underwriting risk class, and more.
*Note: The date filter uses the submit for issue date for issued, withdrawn, and declined case activity. For applications received, the date filter goes off the submission date.
Case Details Drilldown
Right click any point on the visuals and select “Drill through > Case Detail Drilldown” to get your underlying case details.
Exporting Data
Click the “Quick Actions” dropdown in the top right of your screen to send this information to your email. Choosing “Export” will immediately send an email with a file attachment. This email is tied to your InsureSight username.
Choosing “Schedule” will allow you to set up a recurring email to be delivered on the schedule you choose. To modify this schedule, click the “Settings” option in the far-left navigation menu under “InsureSight.”
Fastest Changing Metrics
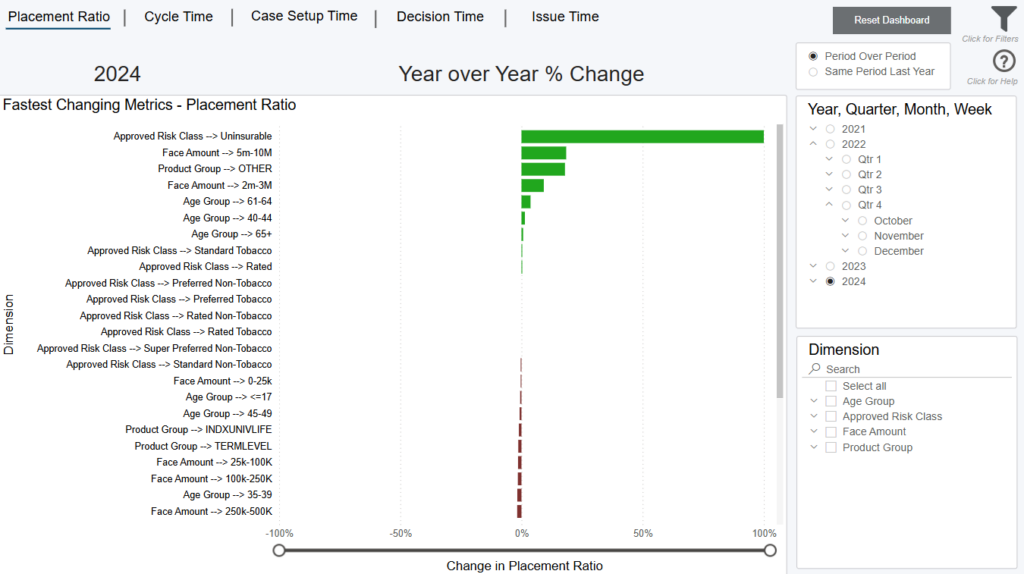
Overview
This dashboard displays the biggest changes in your organization from one time period to another. To provide the most flexible insights, this dashboard allows you to dynamically select which time period, measure, and dimension(s) you want to compare. The bars on the visual represents your percentage change for the selected time period and measure. They-axis shows this percentage change across your selected dimension(s).
Note: if a dimension displays on the chart but has no data (blank) that means it had a zero percent change from the previous time comparison.
Data Definitions
Placement Ratio = number of issued cases divided by number of Issued, Declined, and Withdrawn cases.
Cycle Time = days between submission date and submit for issue date.
Case Setup = days between submission date and underwriting opened date.
Decision = days between underwriting opened date and underwriting decision date.
Issue = days between underwriting decision date and submit for issue date.
Selecting Your Time Period for Comparison
Select the time period you want to compare in the top right of the screen. You can choose a year, quarter, month, or week (expand the selections for more options). Once selected, you have the ability to select in the top right how the comparison should calculate.
Period Over Period = the prior period (i.e. one period back). For example, if you choose Q2 2021, you’re comparing Q2 2021 to Q1 2021 (one quarter back). If you choose March 2021, you’re comparing to February 2021 (one month back).
Same Period Last year = the same time period selected in the date filter in the bottom right of your screen, but back 1 year.
Selecting Your Measure for Comparison
The bar chart displays the percentage change for the time period comparison for either placement ratio, cycle time, case setup time, decision time, or issue time. You can toggle among these options by clicking the “Placement Ratio,” “Cycle Time,”, “Case Setup Time”, “Decision Time”, and “Issue Time” buttons in the top left of the screen.
Selecting Your Dimensions for Comparison
Lastly, choose the dimensions you want to see this percentage change for. You can choose to show all on the chart (displayed on the y axis), or a sub-set by checking the Dimension options to the right of the dashboard.
Example – If you select Q2 2021 as your time period, “Placement Ratio” as your measure, and “Product Group” as your dimension, the bar chart will show your biggest changes in placement ratio from Q1 2021 to Q2 2021 across all your product groups.
Filtering the Dashboard
Choose the Filter icon in the top right of the dashboard to narrow down by face amount, product, distribution channel, underwriting risk class, and more.
*Note: The date filter uses the submit for issue date for issued, withdrawn, and declined case activity. For applications received, the date filter goes off the submission date.
FCM Details Drilldown
Right click any point on the visuals and select “Drill through > FCM Detail Drilldown” to get your underlying case details.
Exporting Data
Click the “Quick Actions” dropdown in the top right of your screen to send this information to your email. Choosing “Export” will immediately send an email with a file attachment. This email is tied to your InsureSight username.
Choosing “Schedule” will allow you to set up a recurring email to be delivered on the schedule you choose. To modify this schedule, click the “Settings” option in the far-left navigation menu under “InsureSight.”
Underwriter Analysis

Overview
This dashboard displays the biggest changes in your organization from one time period to another. To provide the most flexible insights, this dashboard allows you to dynamically select which time period, measure, and dimension(s) you want to compare. The bars on the visual represents your percentage change for the selected time period and measure. They-axis shows this percentage change across your selected dimension(s).
Note: if a dimension displays on the chart but has no data (blank) that means it had a zero percent change from the previous time comparison.
Data Definitions
Placement Ratio = number of issued cases divided by number of Issued, Declined, and Withdrawn cases.
Cycle Time = days between submission date and submit for issue date.
Case Setup = days between submission date and underwriting opened date.
Decision = days between underwriting opened date and underwriting decision date.
Issue = days between underwriting decision date and submit for issue date.
Selecting Your Time Period for Comparison
Select the time period you want to compare in the top right of the screen. You can choose a year, quarter, month, or week (expand the selections for more options). Once selected, you have the ability to select in the top right how the comparison should calculate.
Period Over Period = the prior period (i.e. one period back). For example, if you choose Q2 2021, you’re comparing Q2 2021 to Q1 2021 (one quarter back). If you choose March 2021, you’re comparing to February 2021 (one month back).
Same Period Last year = the same time period selected in the date filter in the bottom right of your screen, but back 1 year.
Selecting Your Measure for Comparison
The bar chart displays the percentage change for the time period comparison for either placement ratio, cycle time, case setup time, decision time, or issue time. You can toggle among these options by clicking the “Placement Ratio,” “Cycle Time,”, “Case Setup Time”, “Decision Time”, and “Issue Time” buttons in the top left of the screen.
Selecting Your Dimensions for Comparison
Lastly, choose the dimensions you want to see this percentage change for. You can choose to show all on the chart (displayed on the y axis), or a sub-set by checking the Dimension options to the right of the dashboard.
Example – If you select Q2 2021 as your time period, “Placement Ratio” as your measure, and “Product Group” as your dimension, the bar chart will show your biggest changes in placement ratio from Q1 2021 to Q2 2021 across all your product groups.
Filtering the Dashboard
Choose the Filter icon in the top right of the dashboard to narrow down by face amount, product, distribution channel, underwriting risk class, and more.
*Note: The date filter uses the submit for issue date for issued, withdrawn, and declined case activity. For applications received, the date filter goes off the submission date.
FCM Details Drilldown
Right click any point on the visuals and select “Drill through > FCM Detail Drilldown” to get your underlying case details.
Exporting Data
Click the “Quick Actions” dropdown in the top right of your screen to send this information to your email. Choosing “Export” will immediately send an email with a file attachment. This email is tied to your InsureSight username.
Choosing “Schedule” will allow you to set up a recurring email to be delivered on the schedule you choose. To modify this schedule, click the “Settings” option in the far-left navigation menu under “InsureSight.”
Underwriter Scorecard

Overview
The Underwriter Scorecard allows you to compare a single, or multiple, underwriters within your organization against the other underwriters in your organization across key performance metrics.
Click the Data Table hyperlink in the bottom right-hand corner of the dashboard to see a table view of the selected underwriter(s) performance.
*Note, this will carry over all filter selections made on the scorecard.
Data Definitions
Selected = the underwriter (or underwriters) you selected from the “Selected Underwriter” filter on screen.
Benchmark = the average of the other underwriters in your organization (those underwriters listed in the “Benchmark Underwriter” filter).
Policies Issued = number of policies issued (final action of Issued) based on the submit for issue date.
Applications Withdrawn = number of withdrawn cases (final action of withdrawn) based on the submit for issue date.
Applications Declined = number of declined cases (final action of declined) based on the submit for issue date.
Policies Issued Ratio = sum of Issued policies divided by sum of Issued, Withdrawn, or Declined cases; this is the same as placement ratio and based on submit for issue date.
Applications Withdrawn Ratio = sum of Withdrawn cases divided by sum of Issued, Withdrawn, or Declined cases; this is the same as placement ratio and based on submit for issue date.
Applications Declined Ratio = sum of Declined cases divided by sum of Issued, Withdrawn, or Declined cases; this is the same as placement ratio and based on submit for issue date.
Filtering the Dashboard
Choose the Filter icon in the top right of the dashboard to narrow down by face amount, product, distribution channel, underwriting risk class, and more.
*Note: The date filter uses the submit for issue date for issued, withdrawn, and declined case activity. For applications received, the date filter goes off the submission date.
Case Details Drilldown
Right click any point on the trend lines and select “Drill through > Case Detail Drilldown” to get your underlying case details.
Exporting Data
Click the “Quick Actions” dropdown in the top right of your screen to send this information to your email. Choosing “Export” will immediately send an email with a file attachment. This email is tied to your InsureSight username.
Choosing “Schedule” will allow you to set up a recurring email to be delivered on the schedule you choose. To modify this schedule, click the “Settings” option in the far-left navigation menu under “InsureSight.”
Agent Analysis
Overview
The Underwriter Scorecard allows you to compare a single, or multiple, underwriters within your organization against the other underwriters in your organization across key performance metrics.
Click the Data Table hyperlink in the bottom right-hand corner of the dashboard to see a table view of the selected underwriter(s) performance.
*Note, this will carry over all filter selections made on the scorecard.
Data Definitions
Selected = the underwriter (or underwriters) you selected from the “Selected Underwriter” filter on screen.
Benchmark = the average of the other underwriters in your organization (those underwriters listed in the “Benchmark Underwriter” filter).
Policies Issued = number of policies issued (final action of Issued) based on the submit for issue date.
Applications Withdrawn = number of withdrawn cases (final action of withdrawn) based on the submit for issue date.
Applications Declined = number of declined cases (final action of declined) based on the submit for issue date.
Policies Issued Ratio = sum of Issued policies divided by sum of Issued, Withdrawn, or Declined cases; this is the same as placement ratio and based on submit for issue date.
Applications Withdrawn Ratio = sum of Withdrawn cases divided by sum of Issued, Withdrawn, or Declined cases; this is the same as placement ratio and based on submit for issue date.
Applications Declined Ratio = sum of Declined cases divided by sum of Issued, Withdrawn, or Declined cases; this is the same as placement ratio and based on submit for issue date.
Filtering the Dashboard
Choose the Filter icon in the top right of the dashboard to narrow down by face amount, product, distribution channel, underwriting risk class, and more.
*Note: The date filter uses the submit for issue date for issued, withdrawn, and declined case activity. For applications received, the date filter goes off the submission date.
Case Details Drilldown
Right click any point on the trend lines and select “Drill through > Case Detail Drilldown” to get your underlying case details.
Exporting Data
Click the “Quick Actions” dropdown in the top right of your screen to send this information to your email. Choosing “Export” will immediately send an email with a file attachment. This email is tied to your InsureSight username.
Choosing “Schedule” will allow you to set up a recurring email to be delivered on the schedule you choose. To modify this schedule, click the “Settings” option in the far-left navigation menu under “InsureSight.”
Cycle Time Analysis
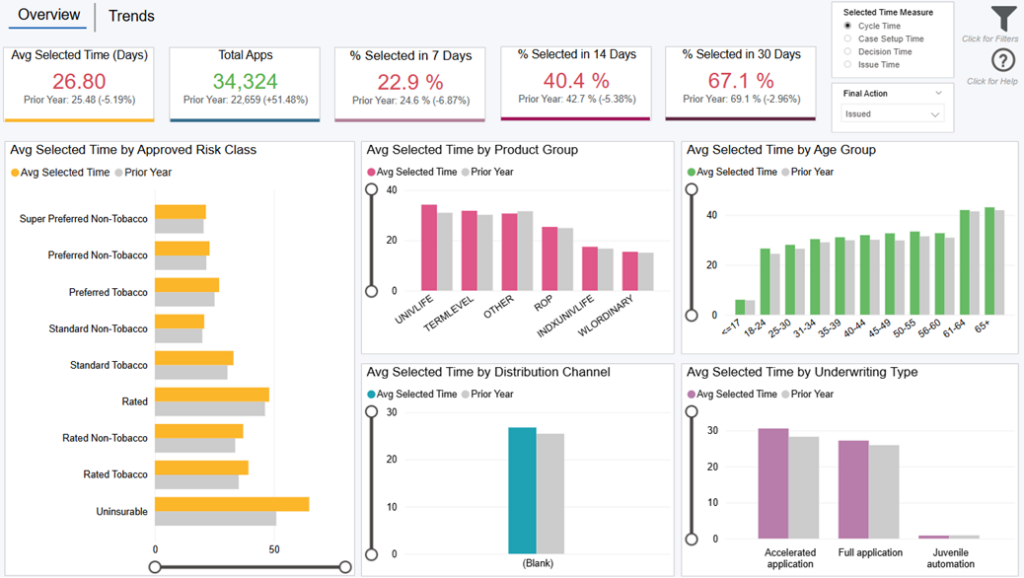
Overview
This dashboard allows you to analyze how placement ratios and cycle times vary across different combinations of approved and applied risk class comparisons for both your applications current year vs. prior year.
Data Definitions
Combo Rate = total application percentage of applied and approved risk class combinations.
Cycle Time = days between submission date and submit for issue date.
Placement Ratio = number of issued cases divided by number of Issued, Declined, and Withdrawn cases.
Policies Issued = number of policies issued (final action of Issued) based on the submit for issue date.
Applications Withdrawn = number of withdrawn cases (final action of withdrawn) based on the submit for issue date.
Applications Declined = number of declined cases (final action of declined) based on the submit for issue date.
Prior Year = the same time period selected in the date filter, but back 1 year.
Filtering the Dashboard
Choose the Filter icon in the top right of the dashboard to narrow down by face amount, product, distribution channel, underwriting risk class, and more.
*Note: The date filter uses the submit for issue date for issued, withdrawn, and declined case activity. For applications received, the date filter goes off the submission date.
Case Details Drilldown
Right click any point on the trend lines and select “Drill through > Case Detail Drilldown” to get your underlying case details.
Exporting Data
Click the “Quick Actions” dropdown in the top right of your screen to send this information to your email. Choosing “Export” will immediately send an email with a file attachment. This email is tied to your InsureSight username.
Choosing “Schedule” will allow you to set up a recurring email to be delivered on the schedule you choose. To modify this schedule, click the “Settings” option in the far-left navigation menu under “InsureSight.”
Placement Ratio Analysis
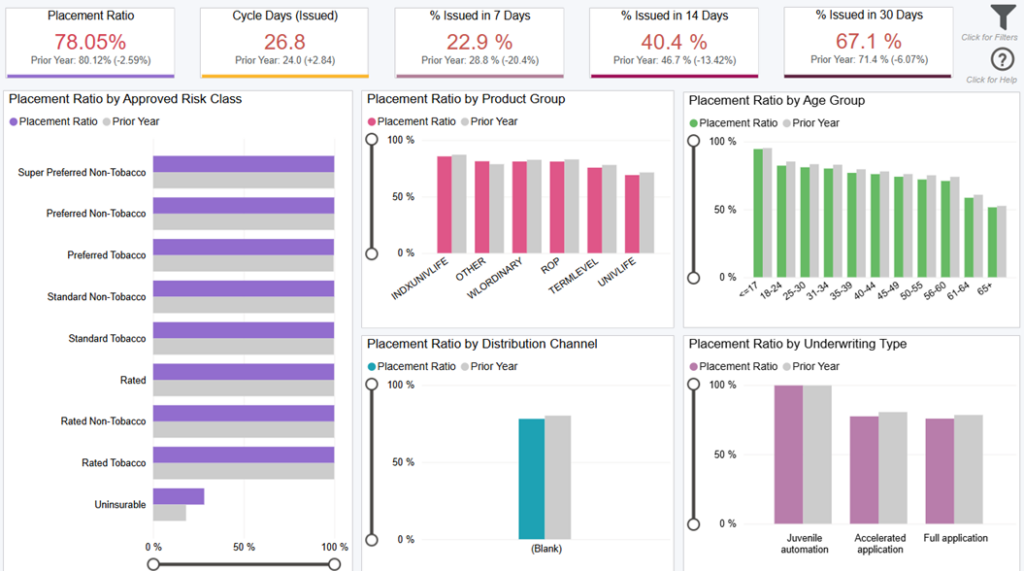
Overview
This dashboard displays your placement ratio performance across various metrics.
*Note: this dashboard is similar to the “Overview” tab on Cycle Time Analysis but looks at placement ratio vs. cycle time.
Data Definitions
Policies Issued = number of policies issued (final action of Issued) based on the submit for issue date.
Placement Ratio = sum of Issued policies divided by sum of Issued, Withdrawn, or Declined cases; this is the same as issued ratio and based on submit for issue date.
Prior Year = the same time period selected in the date filter, but back 1 year.
Cycle Time = days between submission date and submit for issue date.
Filtering the Dashboard
Choose the Filter icon in the top right of the dashboard to narrow down by face amount, product, distribution channel, underwriting risk class, and more.
*Note: The date filter uses the submit for issue date for issued, withdrawn, and declined case activity. For applications received, the date filter goes off the submission date.
Case Details Drilldown
Right click any point on the trend lines and select “Drill through > Case Detail Drilldown” to get your underlying case details.
Exporting Data
Click the “Quick Actions” dropdown in the top right of your screen to send this information to your email. Choosing “Export” will immediately send an email with a file attachment. This email is tied to your InsureSight username.
Choosing “Schedule” will allow you to set up a recurring email to be delivered on the schedule you choose. To modify this schedule, click the “Settings” option in the far-left navigation menu under “InsureSight.”
Activities Life Cycle Time
Overview
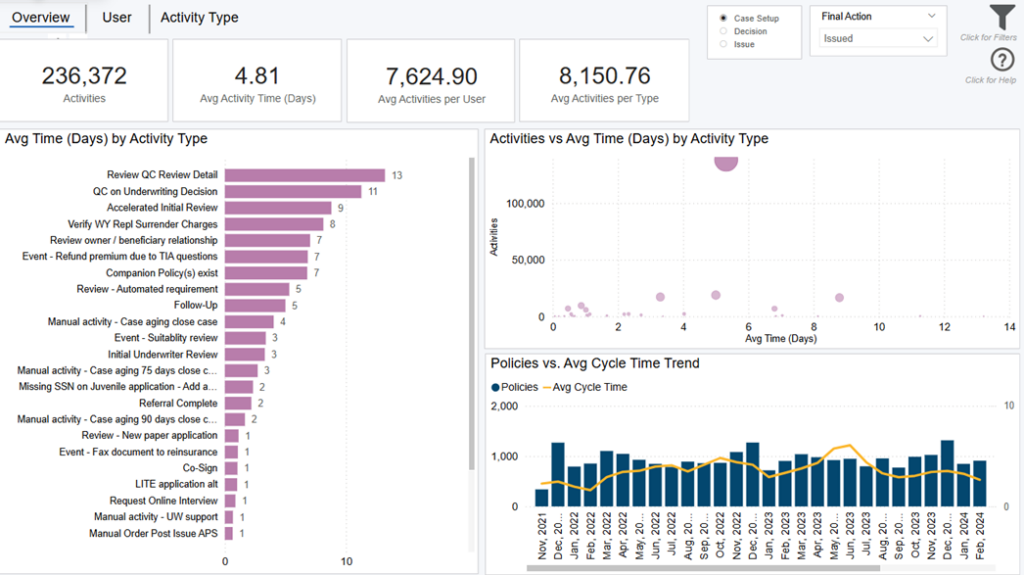
This dashboard displays various metrics around activities. Click tabs in top left corner to see analysis by Overview, User, or Activity Type.
Note: select cycle time stage radio buttons in top right corner (i.e. case setup, decision, & issue) to adjust all metrics on the dashboard to selected stage.
Overview View
This view displays high level metrics around activities, policies, and cycle time.
Data Definitions
Activity Time = days between activity start date and activity end date.
Cycle Time Stage = stage policy is in when the activity started. Note: that activity might end in a later stage, but right now the Cycle Stage for activity is only being tracked based on its activity start date. Also, some instances of a particular activity type might start in one cycle time stage, but other instances of the same activity type might start in a different cycle time stage
Case Setup = if activity start date is before underwriting opened date, then it’s “Case Setup”.
Decision = if activity start date is between the underwriting opened date and the underwriting decision date, then it’s “Decision”.
Issue = If the activity start date is after the Underwriting Decision Date, then it’s “Issue”.
Activities = number of activities with an activity time.
Activity User = person assigned to the activity to work on it.
Avg Activities per User = Activities divided by number of Activity Users.
Avg Activities per Type = Activities divided by number of Activity Types.
User View
This view displays metrics around activity users, volumes, and avg activity times. Each point on the scatterplot represents a user and size of bubble is determined by number of activities.
Activity Type View
This view displays metrics around activity types, volumes, and avg activity times. Each point on the scatterplot represents an activity type and size of bubble is determined by number of activities.
Filtering the Dashboard
Choose the Filter icon in the top right of the dashboard to narrow down by activity user, activity type, face amount, product, distribution channel, underwriting risk class, and more.
*Note: The date filter uses the submit for issue date for issued, withdrawn, and declined case activity. For applications received, the date filter goes off the submission date.
Activity Details Drilldown
Right click any point on the visuals and select “Drill through > Activity Detail Drilldown” to get your underlying activity details.
Activity Profile Comparison
Right click any point on the visuals and select “Drill through > Activity Profile Comparison” to get an activity and user profile analysis.
Exporting Data
Click the “Quick Actions” dropdown in the top right of your screen to send this information to your email. Choosing “Export” will immediately send an email with a file attachment. This email is tied to your InsureSight username.
Choosing “Schedule” will allow you to set up a recurring email to be delivered on the schedule you choose. To modify this schedule, click the “Settings” option in the far-left navigation menu under “InsureSight.”
Requirements Life Cycle Time

Overview
This dashboard displays various metrics around requirements. Click tabs in top left corner to see analysis by Overview, Reviewer, Requirements, Vendor, or Evidence.
*Note: select cycle time stage radio buttons in top right corner (i.e. case setup, decision, & issue) to adjust all metrics on the dashboard to selected stage.
Overview View
This view displays high level metrics around requirements, policies, and cycle time.
Data Definitions
Reviewer = person that completes a requirement. Note: this is not necessarily the underwriter assigned to the policy.
Requirement Time = days between requested date and fulfilled date.
Evidence Time = days between requested date and received date.
Note: that is only defined for requirements that are sent to vendors from within Resonant; i.e. for requirements where the RequestMessageId is not null. Also, this will be null for requirements that are not sent to vendors or are sent to vendors from outside of Resonant; this is when the RequestMessageID is null. Lastly, if requested date or received date is not filled, then this is null.
Evidence Count = number of evidence time values. Note: null evidence time values are not counted.
Avg Vendor Evidence = evidence count divided by number of vendors.
Requirement Review Time = days between received date and fulfilled date.
Requirement Review Count = number of requirement review time values. Note: null requirement review time values are not counted.
Avg Reviewer Requirements = requirement review count divided by number of reviewers.
Cycle Time Stage = stage policy is in when the requirement was started.
Case Setup = if activity start date is before underwriting opened date, then it’s “Case Setup”.
Decision = if activity start date is between the underwriting opened date and the underwriting decision date, then it’s “Decision”.
Issue = If the activity start date is after the Underwriting Decision Date, then it’s “Issue”.
Reviewer View
This view displays details around total requirement volumes and average review time by reviewer.
Requirements View
This view displays details around total requirement volumes and average review time by requirement type.
Vendor View
This view displays details around total evidence volumes and average evidence time by vendor.
Evidence View
This view displays details around total evidence volumes and average evidence time by requirement type.
Filtering the Dashboard
Choose the Filter icon in the top right of the dashboard to narrow down by reviewer, requirement type, vendor, distribution channel, underwriting risk class, and more.
*Note: The date filter uses the submit for issue date for issued, withdrawn, and declined case activity. For applications received, the date filter goes off the submission date.
Requirement Details Drilldown
Right click any point on the visuals and select “Drill through > Requirement Detail Drilldown” to get your underlying requirement details.
Requirement Profile Comparison
Right click any point on the Overview, Reviewer, & Requirements tabs select “Drill through > Requirement Profile Comparison” to get a reviewer and requirement analysis.
Evidence Profile Comparison
Right click any point on the Overview, Vendor, & Evidence tabs select “Drill through > Evidence Profile Comparison” to get an evidence and vendor analysis.
Exporting Data
Click the “Quick Actions” dropdown in the top right of your screen to send this information to your email. Choosing “Export” will immediately send an email with a file attachment. This email is tied to your InsureSight username.
Choosing “Schedule” will allow you to set up a recurring email to be delivered on the schedule you choose. To modify this schedule, click the “Settings” option in the far-left navigation menu under “InsureSight.”
Staffing Productivity
Overview
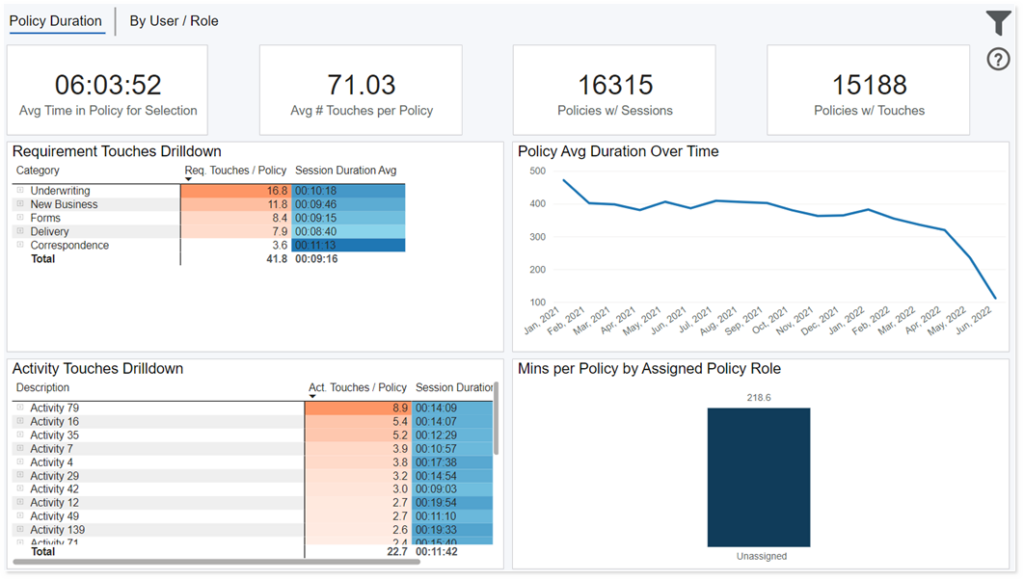
This dashboard displays your policy duration and touches by requirement category, activity category, and assigned policy roles. Click tabs on top left of screen “Policy Duration”, “By User / Role” to switch the staffing productivity analysis.
Data Definitions
Policies Issued = number of policies issued (final action of Issued) based on the submit for issue date.
Sessions = time spent by a user in a given policy in Resonant. Note: sessions are defined by start date/times and end date/times. Each session is associated with just one user. One policy can have many sessions, and one session can have any touches.
Touches = is an action made by a user that makes a change to data within Resonant. Note: all touches belong to a session and made by just one user.
Time = a touch is defined by a specific point in time, down to the second. For example, a change that a user makes in Resonant on 5/18/2024 at 5:32:18pm counts as one touch on a policy. That one touch may affect multiple categories and/or entities.
Entity = touches can change many different pieces of a policy – whether affecting requirements, activities, assessments, etc. An entity is a table within Resonant whose data is changed by a touch. This dashboard focuses on five core entities: Requirements, Activities, Life Policy, & Application Info.
Requirement Touch = a touch made within the requirements entity.
Activity Touch = a touch made within the activities entity.
Prior Year = the same period selected in the date filter, but back 1 year.
Policy Duration Time = sum of the length of all policy’s sessions. For example, all policies for a given month, user, or requirement name.
Roles = two types including assigned policy role and resonant role. An assigned policy role is a user who is “assigned” as one or more specific roles per policy they are assigned to. A resonant role is role user is set in the Resonant application as their default role(s).
Filtering the Dashboard
Choose the Filter icon in the top right of the dashboard to narrow down by user full name, face amount, product, distribution channel, underwriting risk class, and more.
*Note: The date filter uses the submit for issue date for issued, withdrawn, and declined case activity. For applications received, the date filter goes off the submission date.
Case Details Drilldown
Right click point on the trend lines and select “Drill through > Case Detail Drilldown” to get your underlying case details.
Staffing Productivity Drilldown
Right click a single policy number in the table “Staffing Productivity by User” on the By User/Role Tab and select “Drill through > Staffing Productivity Drilldown” to get a productivity analysis on a single policy.
Exporting Data
Click the “Quick Actions” dropdown in the top right of your screen to send this information to your email. Choosing “Export” will immediately send an email with a file attachment. This email is tied to your InsureSight username.
Choosing “Schedule” will allow you to set up a recurring email to be delivered on the schedule you choose. To modify this schedule, click the “Settings” option in the far-left navigation menu under “InsureSight.”
Activity Detail Report
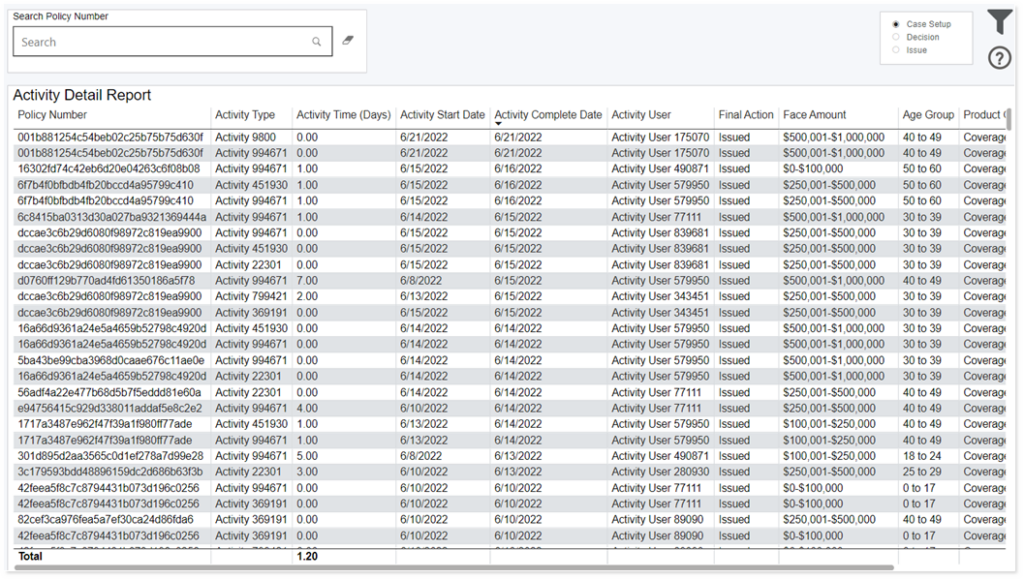
Data Definitions
Policies Issued = number of policies issued (final action of Issued) based on the submit for issue date.
Applications Withdrawn = number of withdrawn cases (final action of withdrawn) based on the submit for issue date.
Applications Declined = number of declined cases (final action of declined) based on the submit for issue date.
Activity Time = days between activity start date and activity end date.
Activity User = person assigned to the activity to work on it.
Filtering the Dashboard
Choose the Filter icon in the top right of the dashboard to narrow down by face amount, product, distribution channel, underwriting risk class, and more.
*Note: The date filter uses the submit for issue date for issued, withdrawn, and declined case activity. For applications received, the date filter goes off the submission date.
Exporting Data
Click the “Quick Actions” dropdown in the top right of your screen to send this information to your email. Choosing “Export” will immediately send an email with a file attachment. This email is tied to your InsureSight username.
Choosing “Schedule” will allow you to set up a recurring email to be delivered on the schedule you choose. To modify this schedule, click the “Settings” option in the far-left navigation menu under “InsureSight.”
Requirement Detail Report

Data Definitions
Policies Issued = number of policies issued (final action of Issued) based on the submit for issue date.
Applications Withdrawn = number of withdrawn cases (final action of withdrawn) based on the submit for issue date.
Applications Declined = number of declined cases (final action of declined) based on the submit for issue date.
Reviewer = person that completes a requirement. Note: this is not necessarily the underwriter assigned to the policy.
Requirement Time = days between requested date and fulfilled date.
Evidence Time = days between requested date and received date. Note: that is only defined for requirements that are sent to vendors from within Resonant; i.e. for requirements where the RequestMessageId is not null. Also, this will be null for requirements that are not sent to vendors or are sent to vendors from outside of Resonant; this is when the RequestMessageID is null. Lastly, if requested date or received date is not filled, then this is null.
Requirement Review Time = days between received date and fulfilled date.
Filtering the Dashboard
Choose the Filter icon in the top right of the dashboard to narrow down by face amount, product, distribution channel, underwriting risk class, and more.
*Note: The date filter uses the submit for issue date for issued, withdrawn, and declined case activity. For applications received, the date filter goes off the submission date.
Exporting Data
Click the “Quick Actions” dropdown in the top right of your screen to send this information to your email. Choosing “Export” will immediately send an email with a file attachment. This email is tied to your InsureSight username.
Choosing “Schedule” will allow you to set up a recurring email to be delivered on the schedule you choose. To modify this schedule, click the “Settings” option in the far-left navigation menu under “InsureSight.”
Case Detail Report
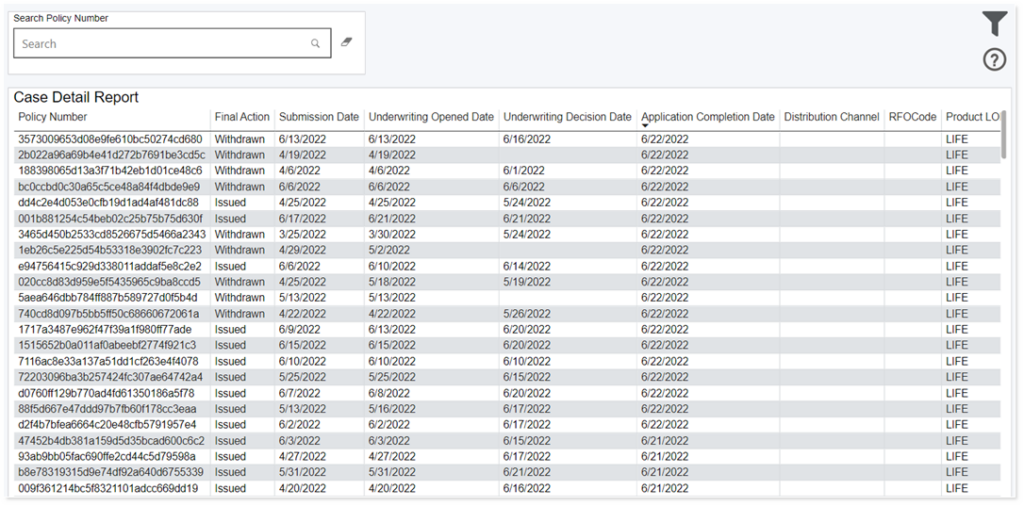
Data Definitions
Policies Issued = number of policies issued (final action of Issued) based on the submit for issue date.
Applications Withdrawn = number of withdrawn cases (final action of withdrawn) based on the submit for issue date.
Applications Declined = number of declined cases (final action of declined) based on the submit for issue date.
Cycle Time = days between submission date and submit for issue date.
Case Setup = days between submission date and underwriting opened date.
Decision = days between underwriting opened date and underwriting decision date.
Issue = days between underwriting decision date and submit for issue date.
Filtering the Dashboard
Choose the Filter icon in the top right of the dashboard to narrow down by face amount, product, distribution channel, underwriting risk class, and more.
*Note: The date filter uses the submit for issue date for issued, withdrawn, and declined case activity. For applications received, the date filter goes off the submission date.
Exporting Data
Click the “Quick Actions” dropdown in the top right of your screen to send this information to your email. Choosing “Export” will immediately send an email with a file attachment. This email is tied to your InsureSight username.
Choosing “Schedule” will allow you to set up a recurring email to be delivered on the schedule you choose. To modify this schedule, click the “Settings” option in the far-left navigation menu under “InsureSight.”