Distributor Case Analytics
Benchmark Criteria

Overview
This dashboard displays the number of BGAs in iPipeline’s network (i.e. all 300+ BGAs leveraging the iPipeline Agency Integrator platform).
iPipeline sorts all the BGAs in this pool by their total paid and closed premium over a rolling 12 month period and breaks the list into 4 quartiles (even segments).
For example, if there are 100 BGAs in the total benchmark, the 1st quartile would be the 25 BGAs with the lowest total paid and closed premium over the last 12 months.
The 4th quartile would be the 25 BGAs with the highest total paid and closed premium. This analysis is completed independently, for both term and permanent business.
Identifying Your Quartiles
On the right side of the dashboard, your total paid premium for both term and permanent business over the last 12 months is displayed, along with which quartile you fall in.
The ranges for all quartiles, and how much of the total paid premium in the benchmark your organization accounts for, (i.e. your wallet share), are displayed below.
Selecting Your Benchmark Criteria
On the left side of the dashboard are your benchmark criteria options.
The first criteria option is to include or exclude yourself from the benchmark. Excluding yourself means that your organization’s data will not be included in any benchmark data you see on the other dashboards.
The second criteria option is to choose the term and permanent business quartiles you would like to be compared to. “No Business” means BGAs who either do either no term or permanent business.
You can choose to make no benchmark criteria selections on this screen, which would benchmark you against all BGAs in the iPipeline network, or you can choose multiple selections.
The number of BGAs in the benchmark will dynamically update based on your selections.
Impact of Benchmark Criteria Selection
Once set, this benchmark selection will apply to all dashboards. For example, if you choose to compare yourself to BGAs in the 4th quartile for permanent business, which maybe 20 BGAs, you will be compared to those 20 other BGAs anywhere there is a “benchmark” comparison on the other dashboards. You can change these settings at any time for a different analysis.
Note: When navigating to the other dashboards, the number of BGAs in the benchmark listed at the top of the page will generally reflect the number noted on the Benchmark Criteria page. Small differences may occur if that dashboard is only showing BGAs with specific data, such as only closed cases on the Lost Business dashboard. Each dashboard’s help layer lists any differences.
Filters

Filtering the Dashboard
Executive Overview
Overview
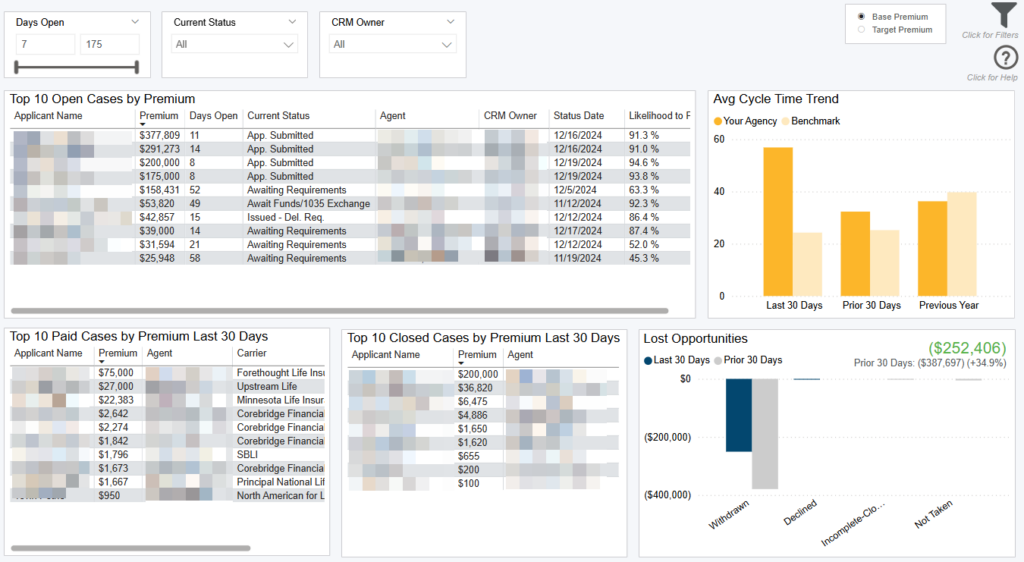
This dashboard allows you to monitor your highest premium cases and what happened over the last rolling 30-day period. Comparative analytics consider “Last 30 Days” as the last 30 days of data, while “Prior 30 Days” is the 30 days before that.
The “Top 10 Highest Open Premium Cases” table allows you to track your highest premium cases that are still in flight by displaying the number of days outstanding, the current status, and the date that status took place. Adjust the “Days Open” slider to pinpoint your threshold of cases at risk of not placing. You can also filter this table by Current Status and CRM Owner.
Note: The Days Open, Current Status, and CRM Owner filters at the top left only filter the top left Top 10 Open Cases by Premium table.
Choose the Filters icon in the top right to filter the entire dashboard. All base premiums/ calculations on this dashboard are using entered base premium which are agent entered values. Hover on any row in the tables to see policy number of case.
The bottom left tables show the top 10 paid and closed cases in the last 30 days. You can also monitor your agency’s efficiency by your trending cycle time, compared to other agencies in the industry (i.e. the benchmark) and how much closed premium occurred across which statuses in the last 30 days versus the 30 days before.
Filtering the Dashboard
Choose the Filter icon in the top right of the dashboard to narrow down by product, case type, agent, organization, and hierarchy. Any selections from this filter pane will dynamically update all visuals on the dashboard.
*Note: The date filter uses Paid, Closed, or Created date. Whenever Submitted cases/premium is used it goes off the Submit date.
Case Details Drilldown
Right click any row on the tables, or bar on the charts, and select “Drill through > Case Detail Drilldown” to get your underlying case details.
Exporting Data
Click the “Quick Actions” dropdown in the top right of your screen to send this information to your email. Choosing “Export” will immediately send an email with a file attachment. This email is tied to your InsureSight username.
Choosing “Schedule” will allow you to set up a recurring email to be delivered on the schedule you choose. To modify this schedule, click the “Settings” option in the far-left navigation menu under “InsureSight.”
Active Pipeline
Overview
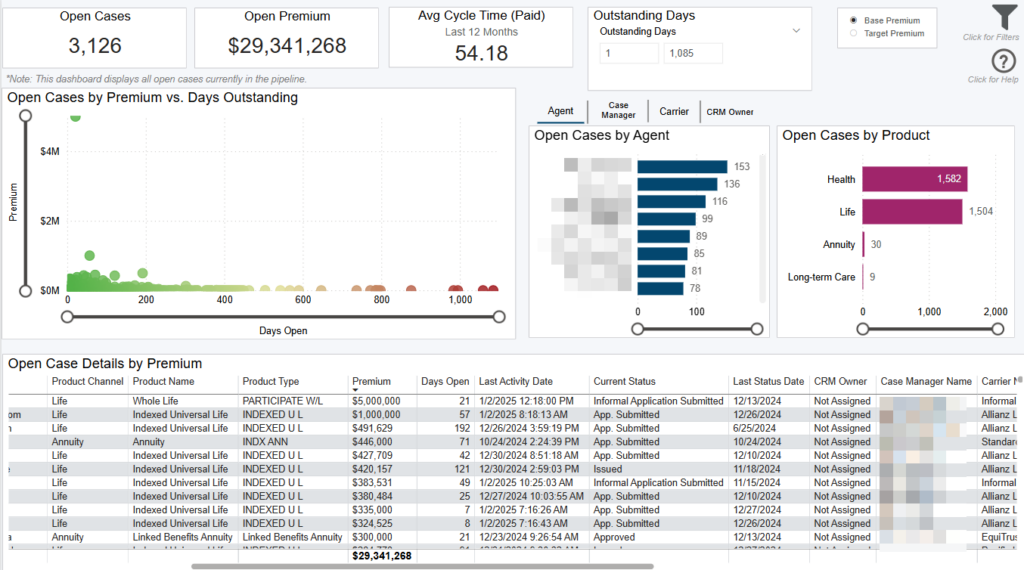
This dashboard displays your cases currently open and which case managers, agents, carriers, etc and products are responsible. Use the Outstanding Days filter directly on the dashboard to segment your open cases pipeline and see details of cases that are getting “stuck”.
Data Definitions
Avg Cycle Time (Paid) = average number of days from the BGA create date to the case paid date (only looking at cycle time of paid cases).
Open Cases = all cases with an open case status.
Open Premium = total premium of all open cases. Use on-screen toggle to look at base or target premium.
Days Outstanding = Days between the create date to today.
Filtering the Dashboard
Choose the Filter icon in the top right of the dashboard to narrow down by carrier, product, case type, agent, hierarchy, and more. Any selections from this filter pane will dynamically update all visuals on the dashboard.
Exporting Data
Click the “Quick Actions” dropdown in the top right of your screen to send this information to your email. Choosing “Export” will immediately send an email with a file attachment. This email is tied to your InsureSight username.
Choosing “Schedule” will allow you to set up a recurring email to be delivered on the schedule you choose. To modify this schedule, click the “Settings” option in the far-left navigation menu under “InsureSight.”
Premium Forecasting
Overview
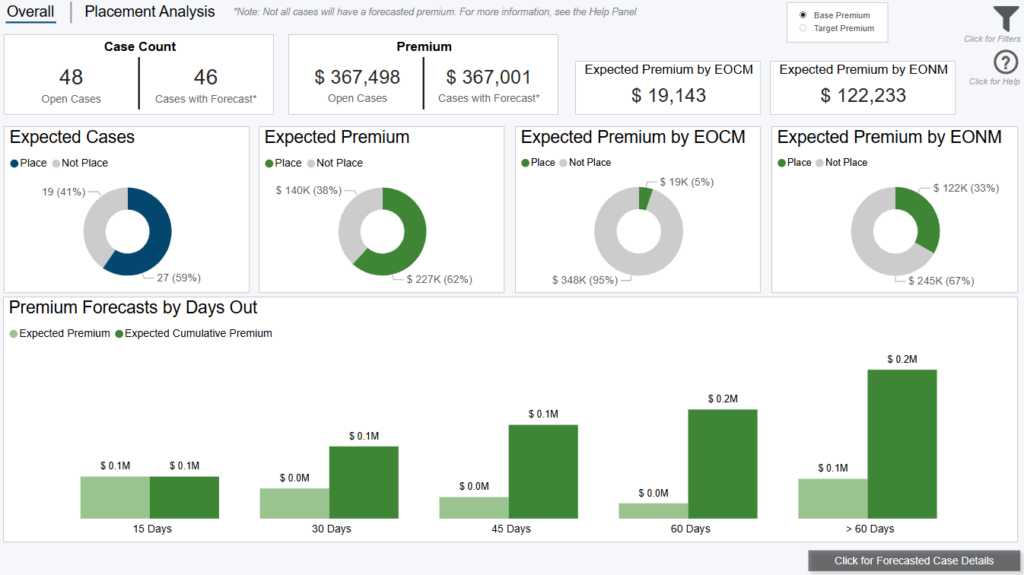
This dashboard displays forecasted premium based on all open formal cases showing their overall Likelihood To Place (LTP) and probability of placing within 15, 30, 45, 60, beyond 60 days, End of Current Month (EOCM), and End of Next Month (EONM). The Forecast can be adjusted with the “Overall Likelihood to Place” slider within the filter pane which allows you to see a more conservative or aggressive outlook on placement.
***Not all cases receive a forecast***
This dashboard will only show open cases that have received a forecast.
There are a variety of reasons in which a case is not scored (i.e., does not have a forecast):
- ONLY formal cases receive a forecast
- ONLY cases with a case status of ‘Open’ receive a forecast (not ‘Unknown’)
- ONLY cases open less than or equal to 200 days receive a forecast
Note: This dashboard only looks at cases that have been open within the last year
Note: Click toggle in top right to switch premium by base or target; base premium uses agent entered values.
Note: By default, the Premium Forecasting dashboards look at only the Life Product Type (this can be updated in the filter pane)
Data Definitions
Expected Cases is calculated as the sum of the Likelihood to Place (LTP) score across all selected cases. For example, if there were two cases open and they had LTP scores of 40% and 80%, respectively. The Expected Cases (to place) would be 1.2 (0.80 + 0.40).
Expected Premium is calculated as the sum of the product of Likelihood to Place (LTP) score and selected premium (Base or Target) across all selected cases. For example, if there were two cases open and they had LTP scores of 40% and 80% and Base premiums of $10,000 and $100,000, respectively. The Expected Premium (to place) would be: 40% * $10,000 + 80% * $100,000 = $4,000 + $80,000 = $84,000
> 60 Days = beyond sixty days from today (excluding day sixty).
Converted from Informal = flag if a case was converted from an informal to formal case.
Converted from Informal (N/A) = still informal or pre application.
EOCM = End of Current Month. This is a dynamic date field that represents the forecasted premium for the end of the current calendar month
Note: As the number of days until the end of the month gets closer to 1, the forecasted premium will vary more
EONM = End of Next Month. This is a dynamic date field that represents the forecasted premium for the end of the next current calendar month
Last 12 Months = Last 12 months from the day you’re viewing the dashboard
Prior Year = The last 12 months starting one year ago
Filtering the Dashboard
Choose the Filter icon in the top right of the dashboard to narrow down by carrier, product, case type, agent, hierarchy, and more. Any selections from this filter pane will dynamically update all visuals on the dashboard.
Note: The date filter uses Paid, Closed, or Created date, however, when submitted cases and/or submitted premium are used it goes off Submitted date.
Premium Forecasting – Case Details Drilldown
Right click any bar from a visual on the “Placement Analysis” tab and select “Drill through > Premium Forecasting – Case Details” to get your underlying case details.
Pipeline Analytics Drilldown
Right click any bar from a visual on the “Placement Analysis” tab and select “Drill through > Pipeline Analytics” to focus in on Placement Ratio and Avg. Cycle Time for open cases by the selected entity. This drilldown will focus on the selected entity and look at how Placement Ratio and Avg. Cycle Times compare Current Year and Prior Year, as well as how each of these have trended on a monthly basis for the date range from the filter panel. You can also look at Premium by Agent and look at the Open Case Details for the selected entity.
Exporting Data
Click the “Quick Actions” dropdown in the top right of your screen to send this information to your email. Choosing “Export” will immediately send an email with a file attachment. This email is tied to your InsureSight username.
Choosing “Schedule” will allow you to set up a recurring email to be delivered on the schedule you choose. To modify this schedule, click the “Settings” option in the far-left navigation menu under “InsureSight.”
AOTA Trends
Overview
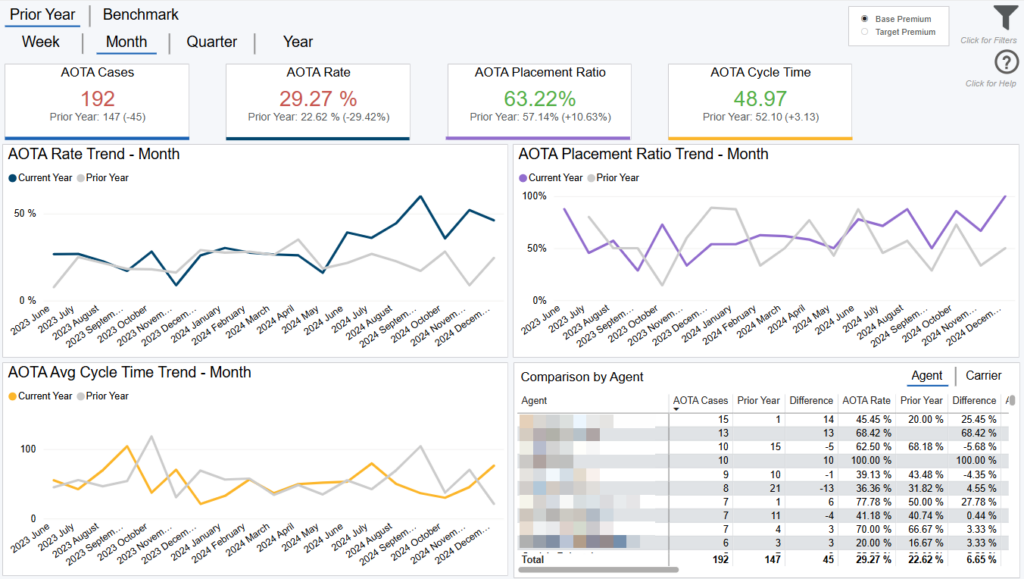
This dashboard displays your Approved Other Than Applied (AOTA) performance across various metrics, in total, and over time, including AOTA Rate, placement ratio, and cycle time.
Comparison Options
The default view for this dashboard is “Prior Year” comparison, meaning this view shows your data for the selected time period and compares to one year back.
Click the “Benchmark” tab to compare your organization’s performance to the other distributors you’re being compared to. The total number of distributors in this benchmark is displayed at the top of the dashboard. As you filter, this number will dynamically update, along with the rest of the dashboard. For any of these comparisons, you can change the time dimension (i.e. x axis) by selecting the “Week,” “Month,” “Quarter,” “Year” buttons in the top left.
Note: The benchmark line is the average of all other agencies.
Data Definitions
Benchmark = the other distributors you’re being compared to (selected on the Benchmark Criteria dashboard)
Cycle Time = the number of days from the agency Create Date to the Paid/Closed date.
Placement Ratio = paid cases / (paid cases + closed cases).
AOTA Rate = Approved Other Than Applied (AOTA) cases / AOTA + Approved As Applied (AAA) Cases. Cases with unknown risk class are excluded from the calculation.
Note that AOTA Rate is very low before May 2021 because this field only officially started to be collected in May 2021. All AOTA cases before this time are identified based on case history data or touches data.
Prior Year = the same time period selected in the date filter, but back 1 year.
Converted from Informal = flag if a case was converted from an informal to formal case.
Converted from Informal (N/A) = still informal or pre application.
Filtering the Dashboard
Choose the Filter icon in the top right of the dashboard to narrow down by carrier, product, premium, face amount, health class, and more.
*Note: The date filter uses Paid, Closed, or Created date. Whenever Submitted cases/premium is used it goes off the Submit date.
Case Details Drilldown
Right click any point on the trend lines and select “Drill through > Drill Case Details” to get your underlying case details.
Fastest Changing Metrics Drilldown
Right click any point on any trend line and select “Drill through > FCM Drill through” to get details behind what changed most in your organization versus the prior period. For example, if you’re looking at a monthly view and drill into placement ratio for February 2024, it would be the change in placement ratio from January 2024 to February 2024.
Exporting Data
Click the “Quick Actions” dropdown in the top right of your screen to send this information to your email. Choosing “Export” will immediately send an email with a file attachment. This email is tied to your InsureSight username.
Choosing “Schedule” will allow you to set up a recurring email to be delivered on the schedule you choose. To modify this schedule, click the “Settings” option in the far-left navigation menu under “InsureSight.”
Risk Class Difference Analysis
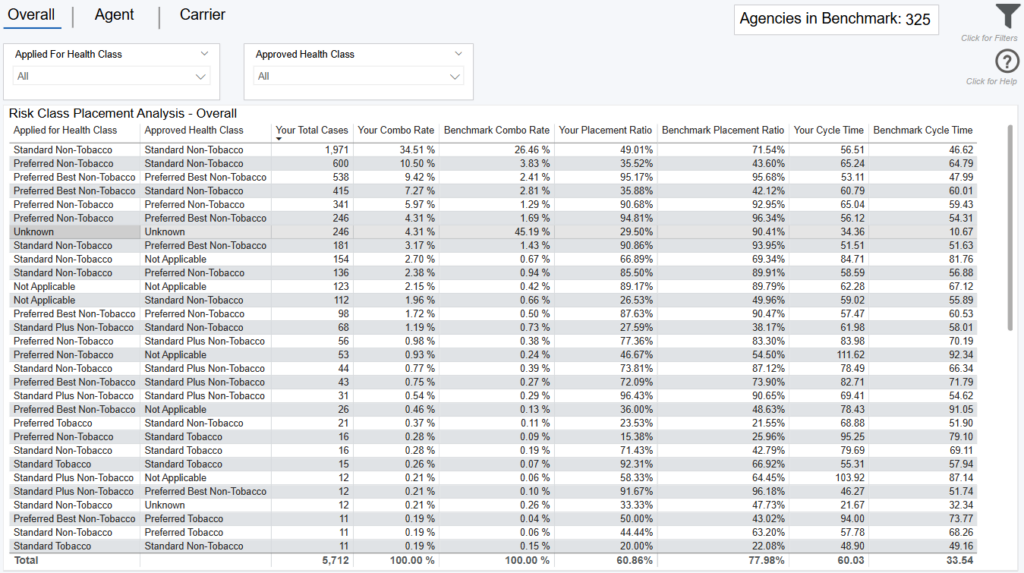
Overview
This dashboard allows you to analyze how placement ratios and cycle times vary across different combinations of approved and applied risk classes for both your cases and cases among agencies chosen as the benchmark from the Benchmark Criteria dashboard. The total number of agencies in this benchmark is displayed at the top of the dashboard. As you filter, this number will dynamically update, along with the rest of the dashboard.
You can change the view by selecting “Overall,” “Agent,” “Carrier” buttons in the top left. Overall shows your total permutations for the applied and approved risk classes, the agent tab compares the same information by agent, and carrier tab compares by carrier.
Note: agent and carrier tabs do not have a benchmark comparison.
Data Definitions
Benchmark = the other agencies you’re being compared to (selected on the Benchmark Criteria dashboard)
Combo Rate = total application percentage of applied and approved risk class combinations.
Cycle Time = the number of days from the agency Create Date to the Paid/Closed date.
Placement Ratio = paid cases / (paid cases + closed cases).
Prior Year = the same time period selected in the date filter, but back 1 year.
Converted from Informal = flag if a case was converted from an informal to formal case.
Converted from Informal (N/A) = still informal or pre application.
Filtering the Dashboard
Choose the Filter icon in the top right of the dashboard to narrow down by carrier, product, premium, face amount, health class, and more.
*Note: The date filter uses Paid, Closed, or Created date. Whenever Submitted cases/premium is used it goes off the Submit date.
Case Details Drilldown
Right click any point on the trend lines and select “Drill through > Drill Case Details” to get your underlying case details.
Exporting Data
Click the “Quick Actions” dropdown in the top right of your screen to send this information to your email. Choosing “Export” will immediately send an email with a file attachment. This email is tied to your InsureSight username.
Choosing “Schedule” will allow you to set up a recurring email to be delivered on the schedule you choose. To modify this schedule, click the “Settings” option in the far-left navigation menu under “InsureSight.”
Operational Trends
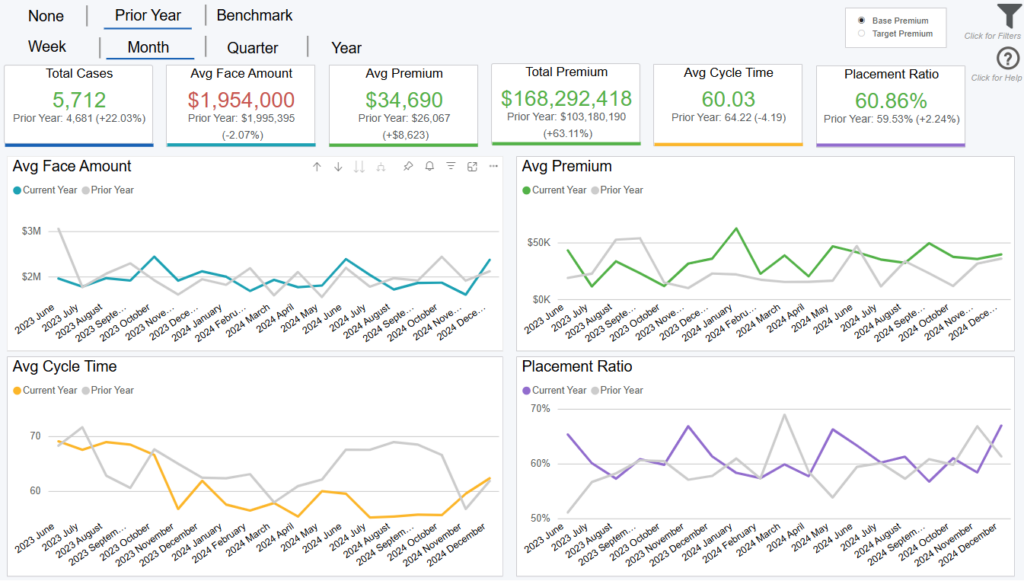
Overview
This dashboard displays your performance across various metrics, in total, and over time, including cases, premium, cycle time, and placement ratio.
Comparison Options
The default view for this dashboard is a “None” comparison, meaning this view shows your data for the selected time period. Click the “Prior Year” button at the top left of the dashboard to compare your organization’s performance one year back.
Click the “Benchmark” button to compare your organization’s performance to the other agencies you’re being compared to. The total number of agencies in this benchmark is displayed at the top of the dashboard. As you filter, this number will dynamically update, along with the rest of the dashboard.
For any of these comparisons, you can change the time dimension (i.e. x axis) by selecting the “Week,” “Month,” “Quarter,” “Year” buttons in the top left. Note: The benchmark line is the average of all other agencies.
Data Definitions
Prior Year = the same time period selected in the date filter, but back 1 year.
Benchmark = the other agencies you’re being compared to (selected on the Benchmark Criteria dashboard).
Cycle Time = the number of days from the agency Create Date to the Paid/Closed date.
Placement Ratio = paid cases / (paid cases + closed cases).
Converted from Informal = flag if a case was converted from an informal to formal case.
Converted from Informal (N/A) = still informal or pre application.
Filtering the Dashboard
Choose the Filter icon in the top right of the dashboard to narrow down by carrier, product, premium, face amount, health class, and more.
*Note: The date filter uses Paid, Closed, or Created date. Whenever Submitted cases/premium is used it goes off the Submit date.
Case Details Drilldown
Right click any point on the trend lines and select “Drill through > Drill Case Details” to get your underlying case details.
Exporting Data
Click the “Quick Actions” dropdown in the top right of your screen to send this information to your email. Choosing “Export” will immediately send an email with a file attachment. This email is tied to your InsureSight username.
Choosing “Schedule” will allow you to set up a recurring email to be delivered on the schedule you choose. To modify this schedule, click the “Settings” option in the far-left navigation menu under “InsureSight.”
Submitted & Paid Cases

Overview
This dashboard displays your performance across various metrics, in total, and over time, focusing on submitted and paid business. You can change the time dimension (i.e. x axis) by selecting “Week”, “Month”, “Quarter”, “Year” buttons in the top left and is defaulted to “Week”.
Data Definitions
Prior Year = the same period as selected in the date filter, but back 1 year.
Submit = a case that has a submitted date.
Converted from Informal = flag if a case was converted from an informal to formal case.
Converted from Informal (N/A) = still informal or pre application.
Filtering the Dashboard
Choose the Filter icon in the top right of the dashboard to narrow down by carrier, product, premium, face amount, health class, and more.
*Note: The date filter uses Paid, Closed, or Created date, however, when submitted cases and/or submitted premium are used it goes off Submitted date.
Case Details Drilldown
Right click any point on the trend lines and select “Drill through > Case Detail Drilldown” to get your underlying case details.
Fastest Changing Metrics Drilldown
Right click any point on the trend lines and select “Drill through > FCM Drill through” to get details behind what changed most in your organization versus the prior period.
Exporting Data
Click the “Quick Actions” dropdown in the top right of your screen to send this information to your email. Choosing “Export” will immediately send an email with a file attachment. This email is tied to your InsureSight username.
Choosing “Schedule” will allow you to set up a recurring email to be delivered on the schedule you choose. To modify this schedule, click the “Settings” option in the far-left navigation menu under “InsureSight.”
Rank Changes
![]()
Overview
This dashboard displays where you rank compared to the other agencies you’ve chosen as the benchmark from the Benchmark Criteria dashboard, across multiple measures such as wallet share and placement ratio.
The cards at the top of the dashboard display your overall rank for the time period selected, while the line chart shows how each of these ranks changed over time. The right y-axis indicates rank changes and you can click the “Week” “Month” “Quarter” “Year” buttons at the top of the dashboard to analyze these rank changes more granularly. A rank of “1” would be the best.
Data Definitions
Agencies in Benchmark = the other agencies you’re being compared to (selected on the Benchmark Criteria dashboard).
Wallet Share = your total paid premium / the sum of paid premium for agencies in the benchmark.
Placement Ratio = paid cases / (paid cases + closed cases).
Cycle Time = the number of days from Submission date to Policy Issue date.
Converted from Informal = flag if a case was converted from an informal to formal case.
Converted from Informal (N/A) = still informal or pre application.
Wallet Share Example
The red and green bars on the chart indicate how much premium you gained or lost due to your changes in wallet share rank. For example, if you ranked 20 out of 60 in January 2021, and then 22 out of 60 in February 2021, you went down 2 ranks (i.e. two agencies did better than you in February vs January).
This dashboard quantifies that wallet share loss from January to February and displays it as a red bar that corresponds with the Gain/Loss left y-axis. The “Wallet Share Change Gain/Loss” card in the top left displays the net gain/loss across the entire time period selected.
Filtering the Dashboard
Choose the Filter icon in the top right of the dashboard to narrow down by carrier, product, premium, face amount, health class, and more.
*Note: The date filter uses Paid, Closed, or Created date. Whenever Submitted cases/premium is used it goes off the Submit date.
Case Details Drilldown
Right click any point on the trend lines and select “Drill through > Drill Case Details” to get your underlying case details.
Exporting Data
Click the “Quick Actions” dropdown in the top right of your screen to send this information to your email. Choosing “Export” will immediately send an email with a file attachment. This email is tied to your InsureSight username.
Choosing “Schedule” will allow you to set up a recurring email to be delivered on the schedule you choose. To modify this schedule, click the “Settings” option in the far-left navigation menu under “InsureSight.”
Fastest Changing Metrics
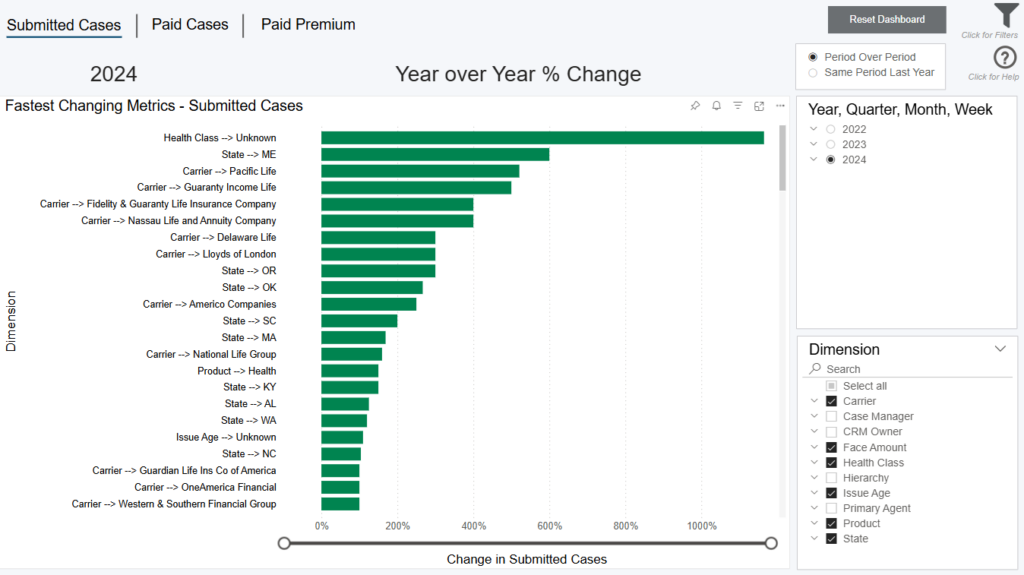
Overview
This dashboard displays the biggest changes in your organization from one time period to another. To provide the most flexible insights, this dashboard allows you to dynamically select which time period, measure, and dimension(s) you want to compare. The bars on the visual represents your percentage change for the selected time period and measure. They-axis shows this percentage change across your selected dimension(s).
Note: if a dimension displays on the chart but has no data (blank) that means it had a zero percent change from the previous time comparison.
Filtering the Dashboard
Choose the Filter icon in the top right of the dashboard to narrow down by agent, carrier, product, premium, face amount, organization, and more.
Some cases with premiums or face amounts outside of realistic bounds had their premiums dropped during cleaning to not skew averages. These cases are not shown by default.
To see these cases, adjust the minimum of the premium and face amount sliders to include 0.
*Note: The date filter uses Paid, Closed, or Created date. Whenever Submitted cases/premium is used it goes off the Submit date. In addition,
– Converted from Informal = flag if a case was converted from an informal to formal case.
– Converted from Informal (N/A) = still informal or pre application.
Selecting Your Time Period for Comparison
Select the time period you want to compare in the top right of the screen. You can choose a year, quarter, month, or week (expand the selections for more options). Once selected, you have the ability to select in the top right how the comparison should calculate.
Period Over Period = the prior period (i.e. one period back). For example, if you choose Q2 2021, you’re comparing Q2 2021 to Q1 2021 (one quarter back). If you choose March 2024, you’re comparing to February 2024 (one month back).
Same Period Last year = the same time period selected in the date filter in the bottom right of your screen, but back 1 year.
Selecting Your Measure for Comparison
The bar chart displays the percentage change for the time period comparison for either submitted cases, paid cases, or paid premium. You can toggle among these options by clicking the “Submitted Cases,” “Paid Cases,” and “Paid Premium” buttons in the top left of the screen.
Selecting Your Dimensions for Comparison
Lastly, choose the dimensions you want to see this percentage change for. You can choose to show all on the chart (displayed on the y axis), or a sub-set by checking the Dimension options to the right of the dashboard.
Example – If you select Q2 2021 as your time period, “Submitted Cases” as your measure, and “Product” as your dimension, the bar chart will show your biggest changes in submitted cases from Q1 2021 to Q2 2021 across all your products.
Exporting Data
Click the “Quick Actions” dropdown in the top right of your screen to send this information to your email. Choosing “Export” will immediately send an email with a file attachment. This email is tied to your InsureSight username.
Choosing “Schedule” will allow you to set up a recurring email to be delivered on the schedule you choose. To modify this schedule, click the “Settings” option in the far-left navigation menu under “InsureSight.”
Lost Business Insights
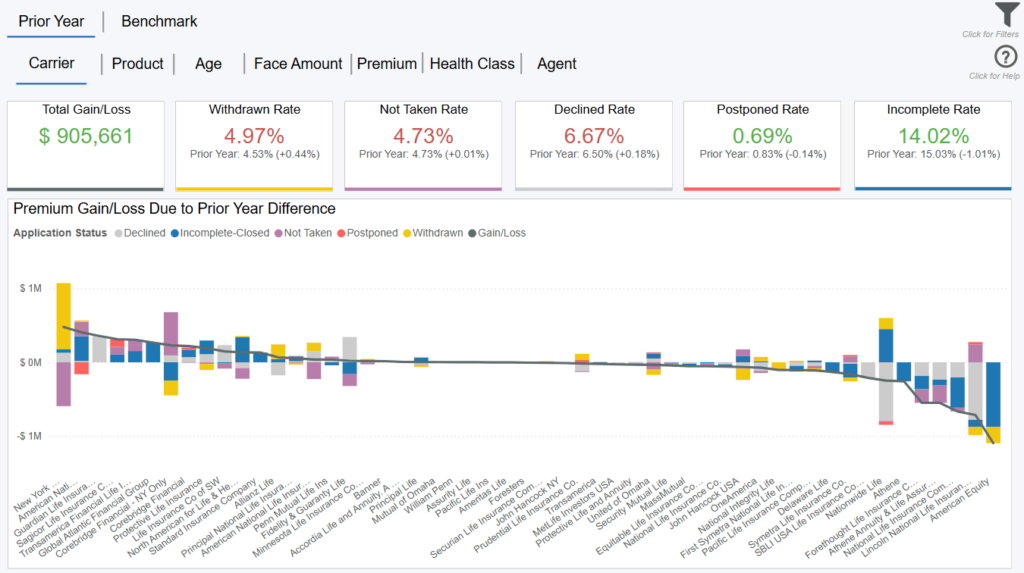
Overview
This dashboard displays your rate of lost business across five closed business statuses and compares to your previous year or the other agencies you’ve chosen as the benchmark from the Benchmark Criteria dashboard.
The Total Gain/Loss is the difference in total premium across the five closed statuses versus the prior year or the benchmark.
Note: This is not your total closed premium for the timeframe, but rather the difference (i.e. how much you over or under-performed versus the prior year or other agencies). Where the largest differences in lost business happened year over year, or versus other agencies, can be seen across your carriers, products, agents, and more. Each section of the bar chart represents one closed business status, as indicated on the legend.
Comparison Options
The default view for this dashboard is a “Prior Year” comparison. This compares your lost business rate in total, and across your carriers, products, agents…etc. year over year.
Click the “Benchmark” button at the top left of the dashboard to compare your performance to the other agencies (selected on the Benchmark Criteria dashboard). The total number of agencies in the benchmark is displayed at the top of the dashboard. As you filter, this number will dynamically update.
Note: These are only agencies with closed business, so the number may be slightly different than shown on the Benchmark Criteria dashboard, which looks at agencies’ total paid and closed business.
On either the “Prior Year” or “Benchmark” view, you can toggle among the “Carrier,” “Product,” “Age,” “Face Amount,” “Premium,” “Health Class,” and “Agent” buttons at the top to get different views of the data. For easy insights, the “Carrier” and “Agent” views are also visible from their respective scorecards.
Data Definitions
Prior Year = the same time period selected in the date filter, but back 1 year.
Benchmark = cases in that status for all agencies in the benchmark / all closed cases for all agencies in the benchmark.
Rate = your cases in that status / all your paid and closed cases.
Difference = Your Rate – Your Previous Year Rate OR the Benchmark Rate.
Converted from Informal = flag if a case was converted from an informal to formal case.
Converted from Informal (N/A) = still informal or pre application.
Net Gain/Loss = Case Gain or Loss due to Rate Difference * Your Avg Premium.
*Note: the Net Gain/Loss is represented in total across all statuses on the top left card. It is also represented by the line on the bar chart, indicating products, agents…etc. where you had the most gain or loss, compared to the prior year or other agencies in the benchmark.
Example
Your organization has a withdrawn rate of 12%, and the benchmark is 10%. You have 2% more withdrawn business than the benchmark. How many cases this accounted for, multiplied by your average premium per case, gets factored into the Total Gain/Loss card.
Where this increased declined rate occurred vs other agencies (i.e. the delta) is shown on the bar chart. The buttons at the top of the dashboard show this delta distribution by Carrier, Product, Agent, and more so you can identify problem areas.
Filtering the Dashboard
Choose the Filter icon in the top right of the dashboard to narrow down by carrier, product, premium, face amount, health class, and more.
*Note: The date filter uses Paid, Closed, or Created date. Whenever Submitted cases/premium is used it goes off the Submit date.
Case Details Drilldown
Right click any point on the trend lines and select “Drill through > Drill Case Details” to get your underlying case details.
Exporting Data
Click the “Quick Actions” dropdown in the top right of your screen to send this information to your email. Choosing “Export” will immediately send an email with a file attachment. This email is tied to your InsureSight username.
Choosing “Schedule” will allow you to set up a recurring email to be delivered on the schedule you choose. To modify this schedule, click the “Settings” option in the far-left navigation menu under “InsureSight.”
Underwriting Insights

Overview
This dashboard displays analytics across underwriting classes, such as your rate, placement ratio, and cycle time and compares you to your prior year’s performance, or the other agencies you’ve chosen as the benchmark from the Benchmark Criteria dashboard. Choose a specific health class, or multiple health classes, from the filter in the top right of the dashboard to analyze performance.
The “Total Gain/Loss” is based on the difference in placement ratio year over year, or versus other agencies, for the selected health class(es). The chart shows where this gain or loss is most significant across your carriers, products, agents, and more.
Comparison Options
The default view for this dashboard is a “Prior Year” comparison. Click the “Benchmark” button at the top left of the dashboard to compare your performance to the other agencies (selected on the Benchmark Criteria dashboard). The total number of agencies in the benchmark is displayed at the top of the dashboard. As you filter, this number will dynamically update.
On either the “Prior Year” or “Benchmark” view, you can toggle among the “Carrier,” “Product,” “Age,” “Face Amount,” “Premium,” “Health Class,” and “Agent” buttons at the top to get different views of the data.
Data Definitions
Health Class Rate = your cases in that health class / all your paid and closed cases.
Benchmark = the average performance of the other agencies you’re being compared to (selected on the Benchmark Criteria dashboard).
Difference = Your Performance – Your Prior Year Performance OR the Benchmark Performance.
Total Gain/Loss = Case Gain or Loss due to Placement Ratio Difference * Your Avg Premium.
Converted from Informal = flag if a case was converted from an informal to formal case.
Converted from Informal (N/A) = still informal or pre application.
Example
Your organization has a placement ratio for standard health class cases of 70%, and the benchmark is 75%. Your placement ratio is 5% worse than other agencies. That 5% delta, multiplied by your total paid and closed cases, equals your case loss for performing below the benchmark. How many cases this accounted for, multiplied by your average premium per case, is displayed on the Total Gain/Loss card.
Where this delta in placement ratio for standard cases vs other agencies specifically occurred is shown on the bar chart. The buttons at the top of the dashboard show this delta distribution by Carrier, Product, Agent, and more so you can identify problem areas.
Filtering the Dashboard
Choose the Filter icon in the top right of the dashboard to narrow down by carrier, product, premium, face amount, gender, age, and more.
*Note: The date filter uses Paid, Closed, or Created date. Whenever Submitted cases/premium is used it goes off the Submit date.
Case Details Drilldown
Right click any point on the bar charts and select “Drill through > Drill Case Details” to get your underlying case details.
Exporting Data
Click the “Quick Actions” dropdown in the top right of your screen to send this information to your email. Choosing “Export” will immediately send an email with a file attachment. This email is tied to your InsureSight username.
Choosing “Schedule” will allow you to set up a recurring email to be delivered on the schedule you choose. To modify this schedule, click the “Settings” option in the far-left navigation menu under “InsureSight.”
Agent Performance
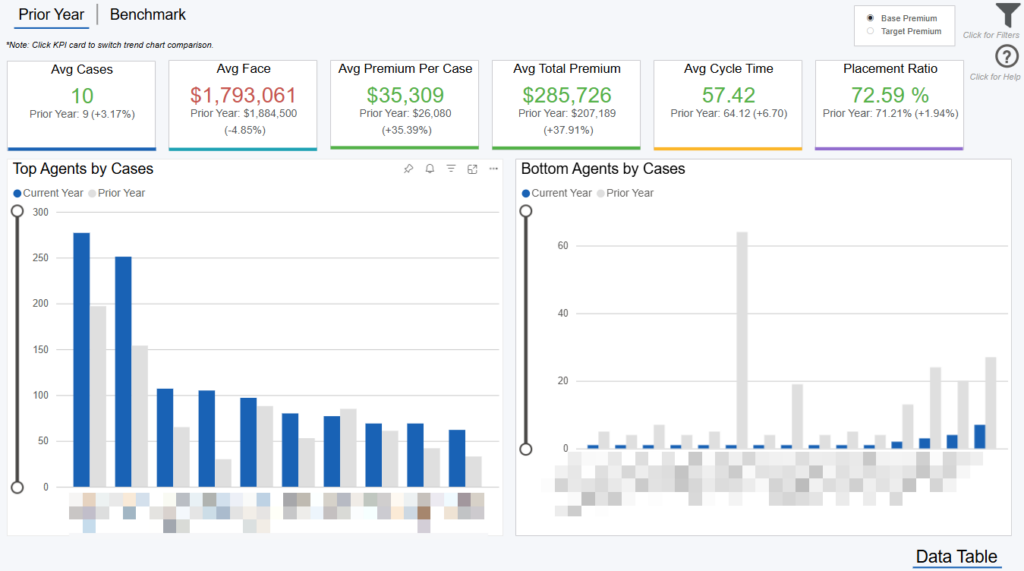
Overview
This dashboard displays your top and bottom agents across key performance indicators such as average cases, average cycle time, and placement ratio. The cards at the top of the screen are representative of all agents in your organization. To narrow by a certain hierarchy, CRM owner, code family, or other criteria, click the Filter icon in the top right of the dashboard.
Of those agents, the top 10 and bottom 10 are displayed on the bar charts, along with their previous year performance. Click any of the cards at the top of the screen (e.g. Avg Cycle Time) to update the charts below, which will display for that performance indicator. Click any agent on the bar chart for the cards to update just for that performer. To see all performance indicators across all your agents at once, click the “Data Table” link in the bottom right of the dashboard.
Comparison Options
The default view for this dashboard is a “Prior Year” comparison. This compares only agents within your own organization.
Click the “Benchmark” button at the top left of the dashboard to compare agents within your organization to the average agent of the agencies you’re being compared to (selected on the Benchmark Criteria dashboard). The “Benchmark” on the cards, as well as the horizontal line on the bar charts, represents the average agent across the other agencies.
Data Definitions
Prior Year = the same time period selected in the date filter, but back 1 year.
Benchmark = the other agencies you’re being compared to (selected on the Benchmark Criteria dashboard).
Avg Cases = total cases / total agents.
Avg Base = total average base premium / total agents.
Total Base = total base premium / total agents.
Cycle Time = the number of days from the agency Create Date to the Paid/Closed date.
Placement Ratio = paid cases / (paid cases + closed cases).
Converted from Informal = flag if a case was converted from an informal to formal case.
Converted from Informal (N/A) = still informal or pre application.
Filtering the Dashboard
Choose the Filter icon in the top right of the dashboard to narrow down by carrier, product, premium, face amount, health class, and more. The 4 “Benchmark Analysis” sliders at the bottom help remove agents not in a certain case volume or premium range, as well as agents who have not submitted a case in a chosen number of days.
*Note: The date filter uses Paid, Closed, or Created date. Whenever Submitted cases/premium is used it goes off the Submit date.
Case Details Drilldown
Right click any point on the bar charts and select “Drill through > Drill Case Details” to get your underlying case details.
Exporting Data
Click the “Quick Actions” dropdown in the top right of your screen to send this information to your email. Choosing “Export” will immediately send an email with a file attachment. This email is tied to your InsureSight username.
Choosing “Schedule” will allow you to set up a recurring email to be delivered on the schedule you choose. To modify this schedule, click the “Settings” option in the far-left navigation menu under “InsureSight.”
Agent Scorecard
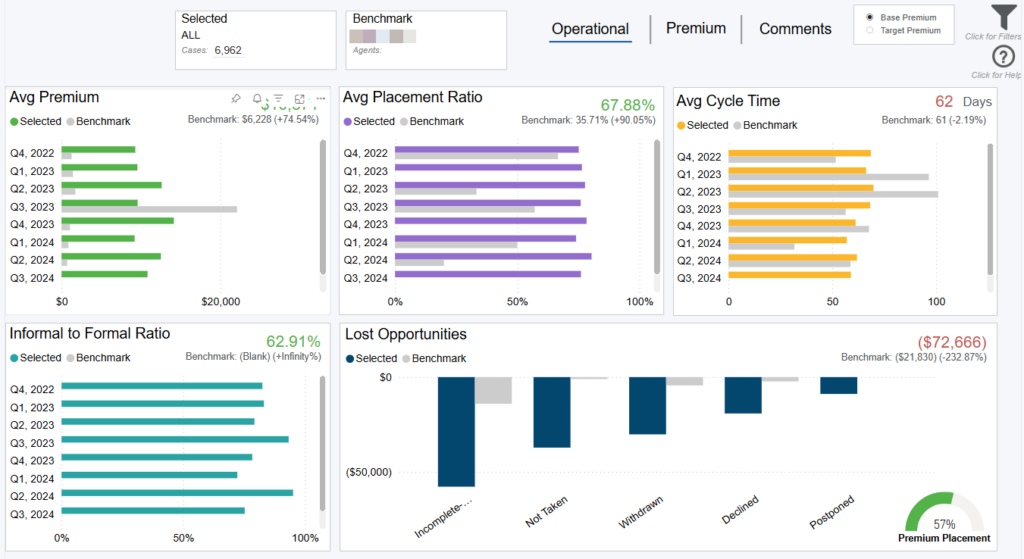
Overview
The agent scorecard allows you to compare a single, or multiple, agents within your organization against the other agents in your organization.
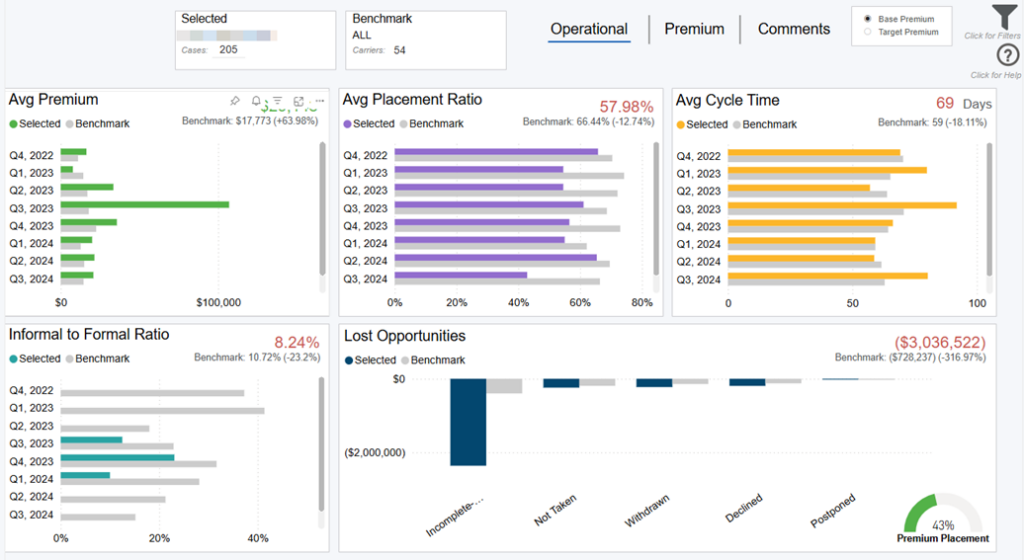
Operational View
This view displays operational metrics for the selected agent(s). On this view, you can choose the Filter icon in the top right of the dashboard to select your agent(s) and agent(s) for comparison (i.e. the “benchmark”).
Note: Hover to the right of ‘Agents:’ on the benchmark card visual to see number of agents in benchmark. All calculations in this view are using normalized base premium (see Data Definitions section below).
By default, the benchmark will consist of all other agents in your organization. To narrow down this pool of agents, you can use the “Cases,” “Base Premium,” “Target Premium,” and/or “Days Since Last Submit” sliders to filter out agents not meaningful for comparison. Alternatively, you can choose a specific agent, or agents, from the “Benchmark Agent” filter.
Data Definitions
Selected = the agent (or agents) you selected from the “Selected Agent” filter
Benchmark = the average of the other agents in your organization (those agents listed in the “Benchmark Agent” filter)
Placement Ratio = paid cases / (paid cases + closed cases)
Cycle Time = the number of days from Submission date to Policy Issue date
Informal to Formal Ratio = converted formals/ (not converted informals + converted formals)
Premium Placement = paid premium / (paid premium + closed premium)
Days Since Last Submit = number of days since the agent’s last submit date
Base Premium Normalized = base premium greater than or equal to $100 and less than or equal to $10,000,000
Base Premium Entered = agent entered values for base premium
Premium View
This view displays premium metrics for the selected agent, including their goals being tracked against actuals. Monthly goals for each agent can be entered inside the Admin section of Agency Integrator.
Note: All base premiums in this view are using entered base premium (see Data Definitions section above).
Comments View
This view displays comments for the selected agent, which, just like goals, can be added for each agent in the Admin section of Agency Integrator.
Filtering the Dashboard
Choose the Filter icon in the top right to narrow down by product, case type, organization, code family, and more. Any selections from this filter pane will dynamically update all visuals on the dashboard.
*Note: The date filter uses Paid, Closed, or Created date. Whenever Submitted cases/premium is used it goes off the Submit date.
Agent Case Details Drilldown
Right click any row on the tables, or bar on the charts, and select “Drill through > Agent Case Details” to get your underlying case details.
Exporting Data
Click the “Quick Actions” dropdown in the top right of your screen to send this information to your email. Choosing “Export” will immediately send an email with a file attachment. This email is tied to your InsureSight username.
Choosing “Schedule” will allow you to set up a recurring email to be delivered on the schedule you choose. To modify this schedule, click the “Settings” option in the far-left navigation menu under “InsureSight.”
Agent % of Business
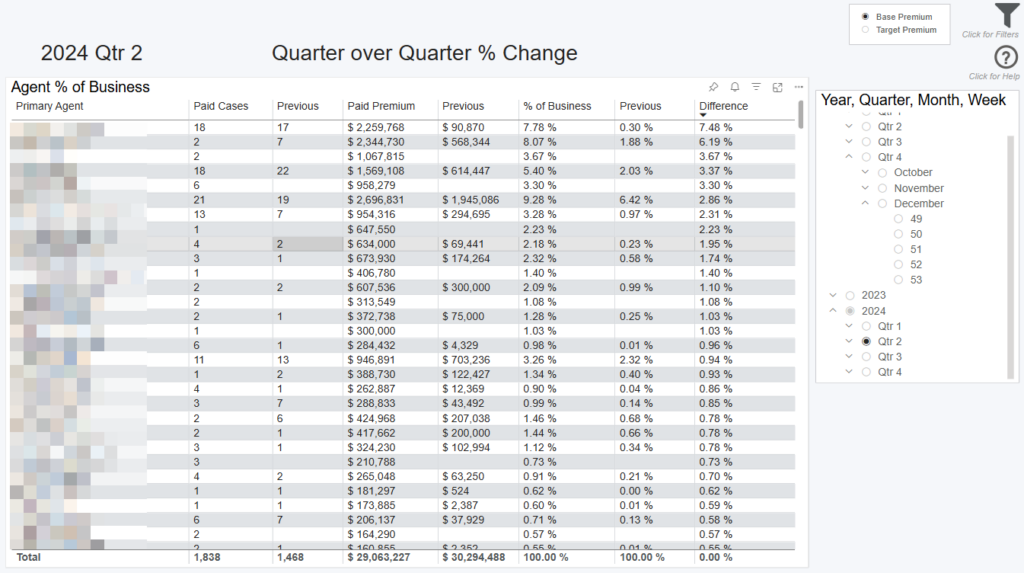
Overview
This dashboard displays details around paid business by agent looking at their percent increase or decrease of your overall business week-over-week, month-over-month, quarter-over-quarter, or year-over-year.
Selecting Your Time Period for Comparison
Select the period you want to compare in the top right of the screen. You can choose a year, quarter, month, or week (expand the selections for more options).
Period Over Period = the prior period (i.e. one period back). For example, if you choose Q2 2024, you’re comparing Q1 2024 to Q2 2024 (one quarter back). If you choose March 2024, you’re comparing to February 2024 (one month back).
Data Definitions
Paid Cases = sum of paid cases for the selected date range.
Paid Premium = sum of paid premium for selected date range.
% of Business = agent paid premium percentage out of your agency’s total.
Difference = % of business this period – previous.
Previous = period over period of paid cases, premium, or % of business.
Converted from Informal = flag if a case was converted from an informal to formal case.
Converted from Informal (N/A) = still informal or pre application.
Filtering the dashboard
Choose the filter icon in the top right of the dashboard to narrow down by agent, carrier, product, premium, face amount, organization and more.
*Note: The date filter uses Paid, Closed, or Created date, however, when submitted cases and/or submitted premium are used it goes off Submitted date.
Case Details Drilldown
Right click any point on the trend lines and select “Drill through > Case Detail Drilldown” to get your underlying case details.
Exporting Data
Click the “Quick Actions” dropdown in the top right of your screen to send this information to your email. Choosing “Export” will immediately send an email with a file attachment. This email is tied to your InsureSight username.
Choosing “Schedule” will allow you to set up a recurring email to be delivered on the schedule you choose. To modify this schedule, click the “Settings” option in the far-left navigation menu under “InsureSight.”
Case Manager Performance

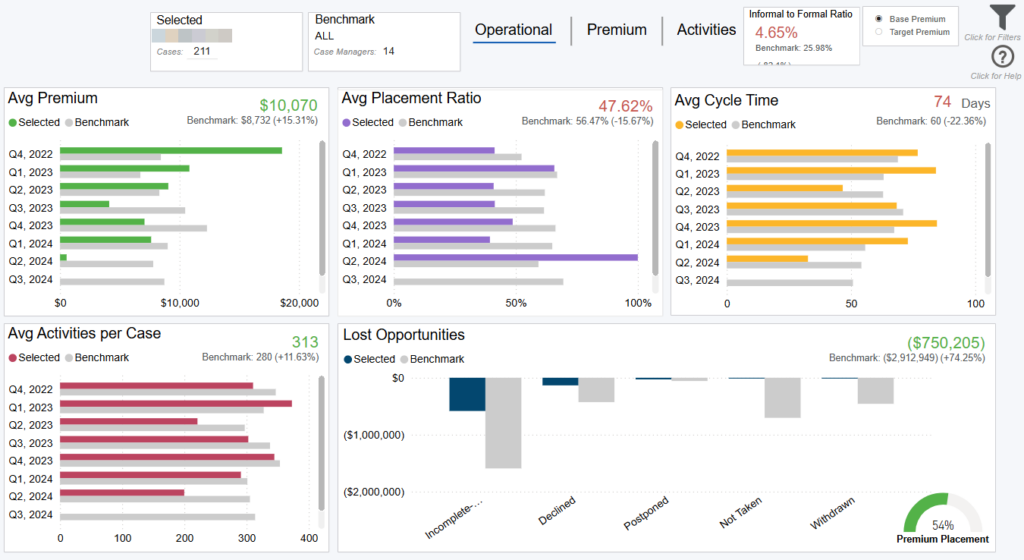
Overview
This dashboard displays your top and bottom case managers across key performance indicators such as average cases, average cycle time, and placement ratio. The cards at the top of the screen are representative of all case managers in your organization.
Performance for all your case managers is displayed on the bar charts, along with their previous year performance. Click any of the cards at the top of the screen (e.g. Avg Cycle Time) to update the chart, which will dynamically display for that performance indicator. Click any case manager on the bar chart for the cards to update just for that performer. To see all performance indicators across all your case managers at once, click the “Data Table” link in the bottom right of the dashboard.
Comparison Options
The default view for this dashboard is a “Prior Year” comparison. This compares only case managers within your own organization.
Click the “Benchmark” button at the top left of the dashboard to compare case managers within your organization to the average case manager of the agencies you’re being compared to (selected on the Benchmark Criteria dashboard). The “Benchmark” on the cards, as well as the horizontal line on the bar charts, represents the average case manager across the other agencies.
Data Definitions
Prior Year = the same time period selected in the date filter, but back 1 year.
Benchmark = the other agencies you’re being compared to (selected on the Benchmark Criteria dashboard).
Avg Cases = total cases / total case managers.
Avg Face = total average face amount / total case managers.
Avg Activity = total average activity per case / total case managers.
Total Activity = sum of activities across all cases.
Cycle Time = the number of days from the agency Create Date to the Paid/Closed date.
Placement Ratio = paid cases / (paid cases + closed cases).
Converted from Informal = flag if a case was converted from an informal to formal case.
Converted from Informal (N/A) = still informal or pre application.
Filtering the Dashboard
Choose the Filter icon in the top right of the dashboard to narrow down by carrier, product, premium, face amount, health class, and more.
*Note: The date filter uses Paid, Closed, or Created date. Whenever Submitted cases/premium is used it goes off the Submit date.
Case Details Drilldown
Right click any point on the bar charts and select “Drill through > Drill Case Details” to get your underlying case details.
Exporting Data
Click the “Quick Actions” dropdown in the top right of your screen to send this information to your email. Choosing “Export” will immediately send an email with a file attachment. This email is tied to your InsureSight username.
Choosing “Schedule” will allow you to set up a recurring email to be delivered on the schedule you choose. To modify this schedule, click the “Settings” option in the far-left navigation menu under “InsureSight.”
Case Manager Scorecard
Overview
The case manager scorecard allows you to compare a single, or multiple, case managers within your organization against the other case managers in your organization.
Operational View
This view displays operational metrics for the selected case manager(s). On this view, you can choose the Filter icon in the top right of the dashboard to select your case manager(s) and case manager(s) for comparison (i.e. the “benchmark”).
Note: All calculations in this view are using normalized base premium (see Data Definitions section below).
By default, the benchmark will consist of all other case managers in your organization. To narrow down this pool of case managers, you can choose a specific case manager, or case managers, from the “Benchmark Case Manager” filter.
Data Definitions
Selected = the case manager (or case managers) you selected from the “Selected Case Manager” filter
Benchmark = the average of the other case managers in your organization (those case managers listed in the “Benchmark Case Manager” filter)
Placement Ratio = paid cases / (paid cases + closed cases)
Cycle Time = the number of days from Submission date to Policy Issue date
Informal to Formal Ratio = converted formals/ (not converted informals + converted formals)
Premium Placement = paid premium / (paid premium + closed premium)
Base Premium Normalized = base premium greater than or equal to $100 and less than or equal to $10,000,000
Base Premium Entered = agent entered values for base premium
Req. Status ID Descriptions = 8 Cancelled, 7 Received, 4 Outstanding, & 3 Waived
Premium View
This view displays premium metrics for the selected case manager. Premium goals for case managers are coming soon and will replace placeholders.
Note: All base premiums in this view are using entered base premium (see Data Definitions section above).
Activities View
This view displays activities on cases that the selected case manager was a part of. Filter the table by touch date, modified by, and more to dig into case manager activity detail.
Filtering the Dashboard
Choose the Filter icon in the top right to narrow down by product, case type, organization, and more. Any selections from this filter pane will dynamically update all visuals on the dashboard.
*Note: The date filter uses Paid, Closed, or Created date. Whenever Submitted cases/premium is used it goes off the Submit date.
Case Manager Case Details Drilldown
Right click any row on the tables, or bar on the charts, and select “Drill through > Case Manager Case Details” to get your underlying case details.
Exporting Data
Click the “Quick Actions” dropdown in the top right of your screen to send this information to your email. Choosing “Export” will immediately send an email with a file attachment. This email is tied to your InsureSight username.
Choosing “Schedule” will allow you to set up a recurring email to be delivered on the schedule you choose. To modify this schedule, click the “Settings” option in the far-left navigation menu under “InsureSight.”
Carrier Performance

Overview
This dashboard displays your top and bottom carriers across key performance indicators such as average cases, average cycle time, and placement ratio. The cards at the top of the screen are representative of all carriers in your organization.
Performance for all your carriers is displayed on the bar charts, along with their previous year performance. Click any of the cards at the top of the screen (e.g. Avg Cycle Time) to update the chart, which will dynamically display for that performance indicator. Click any carrier on the bar chart for the cards to update just for that performer. To see all performance indicators across all your carriers at once, click the “Data Table” link in the bottom right of the dashboard.
Comparison Options
The default view for this dashboard is a “Prior Year” comparison. This compares only carriers within your own organization.
Click the “Benchmark” button at the top left of the dashboard to compare carriers within your organization to the average carrier of the agencies you’re being compared to (selected on the Benchmark Criteria dashboard). The “Benchmark” on the cards, as well as the horizontal line on the bar charts, represents the average carrier across the other agencies.
Data Definitions
Prior Year = the same time period selected in the date filter, but back 1 year.
Benchmark = the other agencies you’re being compared to (selected on the Benchmark Criteria dashboard).
Avg Cases = total cases / total carriers.
Avg Face = total average face amount / total carriers.
Avg Base = total average base premium / total carriers.
Total Base = total base premium / total carriers.
Cycle Time = the number of days from the agency Create Date to the Paid/Closed date.
Placement Ratio = paid cases / (paid cases + closed cases).
Converted from Informal = flag if a case was converted from an informal to formal case.
Converted from Informal (N/A) = still informal or pre application.
Filtering the Dashboard
Choose the Filter icon in the top right of the dashboard to narrow down by date, product, premium, face amount, health class, and more.
*Note: The date filter uses Paid, Closed, or Created date. Whenever Submitted cases/premium is used it goes off the Submit date.
Case Details Drilldown
Right click any point on the bar charts and select “Drill through > Drill Case Details” to get your underlying case details.
Exporting Data
Click the “Quick Actions” dropdown in the top right of your screen to send this information to your email. Choosing “Export” will immediately send an email with a file attachment. This email is tied to your InsureSight username.
Choosing “Schedule” will allow you to set up a recurring email to be delivered on the schedule you choose. To modify this schedule, click the “Settings” option in the far-left navigation menu under “InsureSight.”
Carrier Scorecard
Overview
The carrier scorecard allows you to compare a single, or multiple, carriers within your organization against the other carriers in your organization.
Operational View
This view displays operational metrics for the selected carrier(s). On this view, you can choose the Filter icon in the top right of the dashboard to select your carrier(s) and carrier(s) for comparison (i.e. the “benchmark”). All calculations in this view are using normalized base premium.
Note: All calculations in this view are using normalized base premium (see Data Definitions section below).
By default, the benchmark will consist of all other carriers in your organization. To narrow down this pool of carriers, you can choose a specific carrier, or carriers, from the “Benchmark Carrier” filter.
Data Definitions
Selected = the carrier (or carriers) you selected from the “Selected Carrier” filter
Benchmark = the average of the other carriers in your organization (those carriers listed in the “Benchmark Carrier” filter)
Placement Ratio = paid cases / (paid cases + closed cases)
Cycle Time = the number of days from Submission date to Policy Issue date
Informal to Formal Ratio = converted formals/ (not converted informals + converted formals)
Premium Placement = paid premium / (paid premium + closed premium)
Base Premium Normalized = base premium greater than or equal to $100 and less than or equal to $10,000,000
Base Premium Entered = agent entered values for base premium
Premium View
This view displays premium metrics for the selected carrier.Premium goals for carriers are coming soon and will replace placeholders.
Note: All base premiums in this view are using entered base premium (see Data Definitions section above).
Comments View
Carrier comments are coming soon and will replace placeholder.
Filtering the Dashboard
Choose the Filter icon in the top right to narrow down by product, case type, organization, and more. Any selections from this filter pane will dynamically update all visuals on the dashboard.
*Note: The date filter uses Paid, Closed, or Created date. Whenever Submitted cases/premium is used it goes off the Submit date.
Carrier Case Details Drilldown
Right click any row on the tables, or bar on the charts, and select “Drill through > Carrier Case Details” to get your underlying case details.
Exporting Data
Click the “Quick Actions” dropdown in the top right of your screen to send this information to your email. Choosing “Export” will immediately send an email with a file attachment. This email is tied to your InsureSight username.
Choosing “Schedule” will allow you to set up a recurring email to be delivered on the schedule you choose. To modify this schedule, click the “Settings” option in the far-left navigation menu under “InsureSight.”
CRM Owner Performance

Overview
This dashboard displays your top and bottom CRM owners across key performance indicators such as average cases, average cycle time, and placement ratio. The cards at the top of the screen are representative of all CRM owners in your organization.
Performance for all your CRM owners is displayed on the bar charts, along with their previous year performance. Click any of the cards at the top of the screen (e.g. Avg Cycle Time) to update the chart, which will dynamically display for that performance indicator. Click any CRM owner on the bar chart for the cards to update just for that performer. To see all performance indicators across all your CRM owners at once, click the “Data Table” link in the bottom right of the dashboard.
Comparison Options
The default view for this dashboard is a “Prior Year” comparison. This compares only CRM owners within your own organization.
Click the “Benchmark” button at the top left of the dashboard to compare CRM owners within your organization to the average CRM owner of the agencies you’re being compared to (selected on the Benchmark Criteria dashboard). The “Benchmark” on the cards, as well as the horizontal line on the bar charts, represents the average CRM owner across the other agencies
Data Definitions
Prior Year = the same time period selected in the date filter, but back 1 year.
Benchmark = the other agencies you’re being compared to (selected on the Benchmark Criteria dashboard).
Avg Cases = total cases / total CRM owners.
Avg Face = total average face amount / total CRM owners.
Avg Base = total average base premium / total CRM owners.
Total Base = total base premium / total CRM owners.
Cycle Time = the number of days from the agency Create Date to the Paid/Closed date.
Placement Ratio = paid cases / (paid cases + closed cases).
Converted from Informal = flag if a case was converted from an informal to formal case.
Converted from Informal (N/A) = still informal or pre application.
Filtering the Dashboard
Choose the Filter icon in the top right of the dashboard to narrow down by carrier, product, premium, face amount, health class, and more.
*Note: The date filter uses Paid, Closed, or Created date. Whenever Submitted cases/premium is used it goes off the Submit date.
Case Details Drilldown
Right click any point on the bar charts and select “Drill through > Drill Case Details” to get your underlying case details.
Exporting Data
Click the “Quick Actions” dropdown in the top right of your screen to send this information to your email. Choosing “Export” will immediately send an email with a file attachment. This email is tied to your InsureSight username.
Choosing “Schedule” will allow you to set up a recurring email to be delivered on the schedule you choose. To modify this schedule, click the “Settings” option in the far-left navigation menu under “InsureSight.”
CRM Owner Scorecard

Overview
The CRM Owner scorecard allows you to compare a single, or multiple, CRM Owners within your organization against the other CRM Owners in your organization.
Operational View
This view displays operational metrics for the selected CRM Owner(s). On this view, you can choose the Filter icon in the top right of the dashboard to select your CRM Owner(s) and CRM Owner(s) for comparison (i.e. the “benchmark”).
Note: All calculations in this view are using normalized base premium (see Data Definitions section below).
By default, the benchmark will consist of all other CRM Owners in your organization. To narrow down this pool of CRM Owners, you can choose a specific CRM Owner, or CRM Owners, from the “Benchmark CRM Owner” filter.
Data Definitions
Selected = the CRM Owner (or CRM Owners) you selected from the “Selected CRM Owner” filter
Benchmark = the average of the other CRM Owners in your organization (those CRM Owners listed in the “Benchmark CRM Owner” filter)
Placement Ratio = paid cases / (paid cases + closed cases)
Cycle Time = the number of days from Submission date to Policy Issue date
Informal to Formal Ratio = converted formals/ (not converted informals + converted formals)
Premium Placement = paid premium / (paid premium + closed premium)
Base Premium Normalized = base premium greater than or equal to $100 and less than or equal to $10,000,000
Base Premium Entered = agent entered values for base premium
Premium View
This view displays premium metrics for the selected CRM Owner. Premium goals for CRM Owners are coming soon and will replace placeholders.
Note: All base premiums in this view are using entered base premium (see Data Definitions section above).
Comments View
CRM Owner comments are coming soon and will replace placeholder.
Filtering the Dashboard
Choose the Filter icon in the top right to narrow down by product, case type, organization, and more. Any selections from this filter pane will dynamically update all visuals on the dashboard.
*Note: The date filter uses Paid, Closed, or Created date. Whenever Submitted cases/premium is used it goes off the Submit date.
CRM Owner Case Details Drilldown
Right click any row on the tables, or bar on the charts, and select “Drill through > CRM Owner Case Details” to get your underlying case details.
Exporting Data
Click the “Quick Actions” dropdown in the top right of your screen to send this information to your email. Choosing “Export” will immediately send an email with a file attachment. This email is tied to your InsureSight username.
Choosing “Schedule” will allow you to set up a recurring email to be delivered on the schedule you choose. To modify this schedule, click the “Settings” option in the far-left navigation menu under “InsureSight.”
Hierarchy Performance
Overview
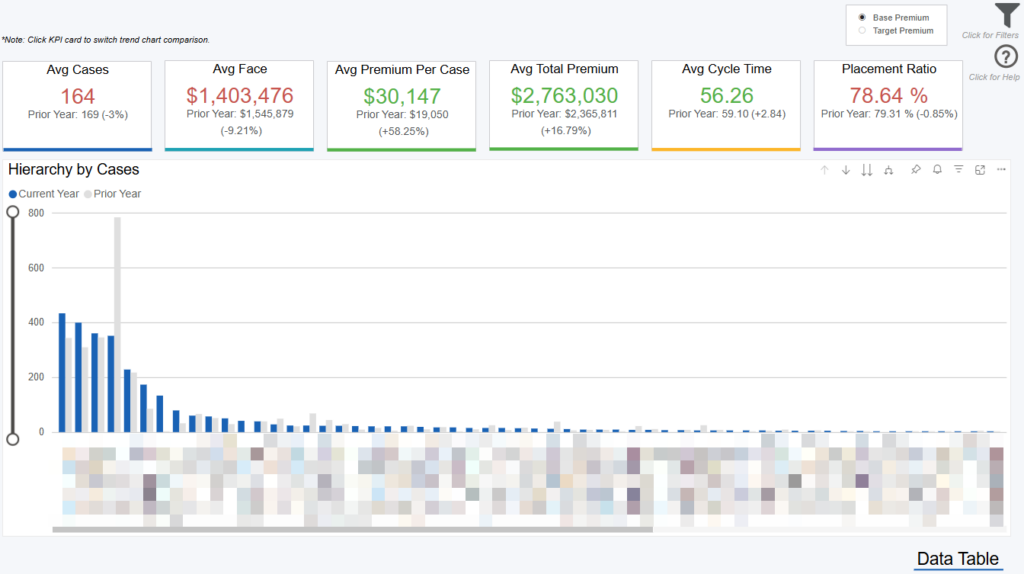
This dashboard displays your top and bottom hierarchies across key performance indicators such as average cases, average cycle time, and placement ratio. The cards at the top of the screen are representative of all hierarchies in your organization.
Performance for all your hierarchies is displayed on the bar charts, along with their previous year performance. Click any of the cards at the top of the screen (e.g. Avg Cycle Time) to update the chart, which will dynamically display for that performance indicator. Click any hierarchy on the bar chart for the cards to update just for that performer. To see all performance indicators across all your hierarchies at once, click the “Data Table” link in the bottom right of the dashboard.
Data Definitions
Prior Year = the same time period selected in the date filter, but back 1 year.
Avg Cases = total cases / total hierarchies.
Avg Face = total average face amount / total hierarchies.
Avg Base = total average base premium / total hierarchies.
Total Base = total base premium / total hierarchies.
Cycle Time = the number of days from the agency Create Date to the Paid/Closed date.
Placement Ratio = paid cases / (paid cases + closed cases).
Converted from Informal = flag if a case was converted from an informal to formal case.
Converted from Informal (N/A) = still informal or pre application.
Filtering the Dashboard
Choose the Filter icon in the top right of the dashboard to narrow down by carrier, product, premium, face amount, health class, and more.
*Note: The date filter uses Paid, Closed, or Created date. Whenever Submitted cases/premium is used it goes off the Submit date.
Case Details Drilldown
Right click any point on the bar charts and select “Drill through > Drill Case Details” to get your underlying case details.
Exporting Data
Click the “Quick Actions” dropdown in the top right of your screen to send this information to your email. Choosing “Export” will immediately send an email with a file attachment. This email is tied to your InsureSight username.
Choosing “Schedule” will allow you to set up a recurring email to be delivered on the schedule you choose. To modify this schedule, click the “Settings” option in the far-left navigation menu under “InsureSight.”
Hierarchy Scorecard
Overview
The Hierarchy scorecard allows you to compare a single, or multiple, Hierarchies within your organization against the other Hierarchies in your organization.
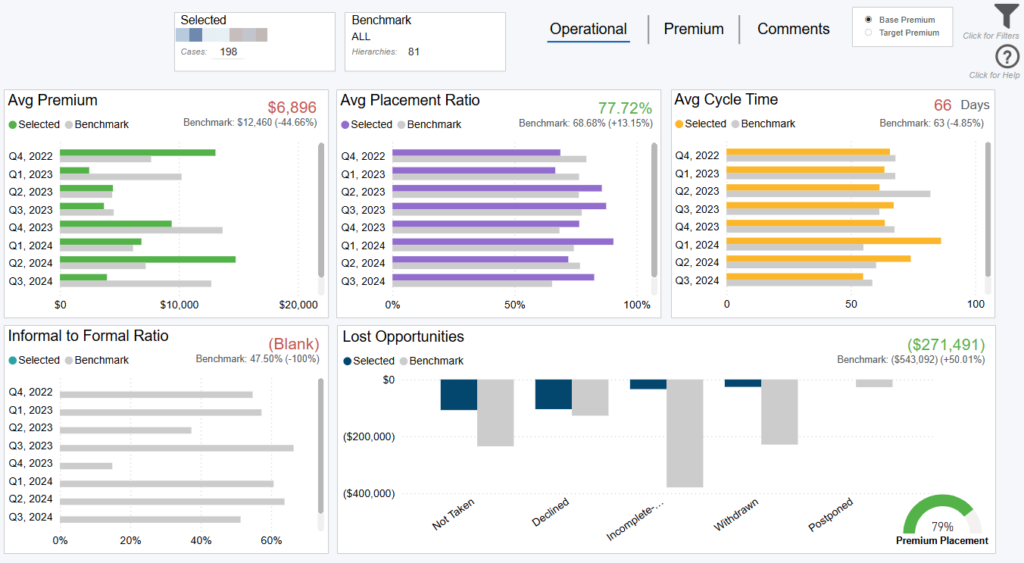
Operational View
This view displays operational metrics for the selected Hierarchy or Hierarchies. On this view, you can choose the Filter icon in the top right of the dashboard to select your Hierarchy or Hierarchies and Hierarchy or Hierarchies for comparison (i.e. the “benchmark”).
Note: All calculations in this view are using normalized base premium (see Data Definitions section below).
By default, the benchmark will consist of all other Hierarchies in your organization. To narrow down this pool of Hierarchies, you can choose a specific Hierarchy, or Hierarchies, from the “Benchmark Hierarchy” filter.
Data Definitions
Selected = the Hierarchy (or Hierarchies) you selected from the “Selected Hierarchy” filter
Benchmark = the average of the other Hierarchies in your organization (those Hierarchies listed in the “Benchmark Hierarchy” filter)
Placement Ratio = paid cases / (paid cases + closed cases)
Cycle Time = the number of days from Submission date to Policy Issue date
Informal to Formal Ratio = converted formals/ (not converted informals + converted formals)
Premium Placement = paid premium / (paid premium + closed premium)
Base Premium Normalized = base premium greater than or equal to $100 and less than or equal to $10,000,000
Base Premium Entered = agent entered values for base premium
Premium View
This view displays premium metrics for the selected Hierarchy. Premium goals for Hierarchies are coming soon and will replace placeholders.
Note: All base premiums in this view are using entered base premium (see Data Definitions section above).
Comments View
Hierarchy comments are coming soon and will replace placeholder.
Filtering the Dashboard
Choose the Filter icon in the top right to narrow down by product, case type, organization, and more. Any selections from this filter pane will dynamically update all visuals on the dashboard.
*Note: The date filter uses Paid, Closed, or Created date. Whenever Submitted cases/premium is used it goes off the Submit date.
Hierarchy Case Details Drilldown
Right click any row on the tables, or bar on the charts, and select “Drill through > Hierarchy Case Details” to get your underlying case details.
Exporting Data
Click the “Quick Actions” dropdown in the top right of your screen to send this information to your email. Choosing “Export” will immediately send an email with a file attachment. This email is tied to your InsureSight username.
Choosing “Schedule” will allow you to set up a recurring email to be delivered on the schedule you choose. To modify this schedule, click the “Settings” option in the far-left navigation menu under “InsureSight.”
License Overview
Overview
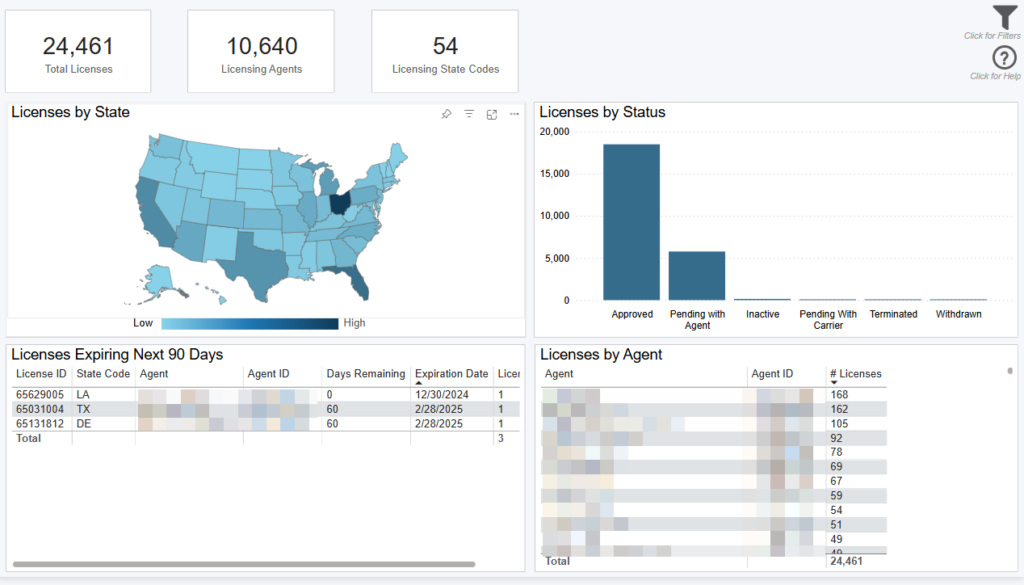
This dashboard displays details around your agent licenses.
Filtering the Dashboard
Choose the Filter icon in the top right of the dashboard to narrow down by agent, state code, and status. Any selections from this filter pane will dynamically update all visuals on the dashboard.
*Note: The date filter goes off the License Effective Date. By Default the filter displays all license data, even licenses that have a blank effective date.
License Drilldown
Right click any row on the visuals and select “Drill through > License Drill” to get details around licenses.
Exporting Data
Click the “Quick Actions” dropdown in the top right of your screen to send this information to your email. Choosing “Export” will immediately send an email with a file attachment. This email is tied to your InsureSight username.
Choosing “Schedule” will allow you to set up a recurring email to be delivered on the schedule you choose. To modify this schedule, click the “Settings” option in the far-left navigation menu under “InsureSight.”
Appointment Overview

Overview
This dashboard displays details around your agent appointments by carrier.
Filtering the Dashboard
Choose the Filter icon in the top right of the dashboard to narrow down by carrier, agent, and status. Any selections from this filter pane will dynamically update all visuals on the dashboard.
*Note: The date filter goes off the Appointment Effective Date. By Default the filter displays all appointment data, even appointments that have a blank effective date.
Appointment Drilldown
Right click any row on the visuals and select “Drill through > Appointment Drill” to get details around appointments.
Exporting Data
Click the “Quick Actions” dropdown in the top right of your screen to send this information to your email. Choosing “Export” will immediately send an email with a file attachment. This email is tied to your InsureSight username.
Choosing “Schedule” will allow you to set up a recurring email to be delivered on the schedule you choose. To modify this schedule, click the “Settings” option in the far-left navigation menu under “InsureSight.”
Activity Report

Overview
This dashboard provides activity details for all cases.
Data Definitions
Modified By = user who touched the case
Activity = specifies type of touch made on a case
Paid, Closed, Created Date Filter = filters cases that fall out of the range
Req. Status ID Descriptions = 8 Cancelled, 7 Received, 4 Outstanding, & 3 Waived
Touch Date Filter = filters touches that fall out of the range
Filtering the Dashboard
Choose the Filter icon in the top right to narrow down by Paid, Closed, Created Date, Modified By, Activity, and Touch Date. Any selections from this filter pane will dynamically update all visuals on the dashboard.
Use the ‘Search Case ID’ filter directly on dashboard to see activities for a specific case.
*Note: The date filter uses Paid, Closed, or Created date. Whenever Submitted cases/premium is used it goes off the Submit date.
Exporting Data
Click the “Quick Actions” dropdown in the top right of your screen to send this information to your email. Choosing “Export” will immediately send an email with a file attachment. This email is tied to your InsureSight username.
Choosing “Schedule” will allow you to set up a recurring email to be delivered on the schedule you choose. To modify this schedule, click the “Settings” option in the far-left navigation menu under “InsureSight.”
Premium Forecast Case Detail Report
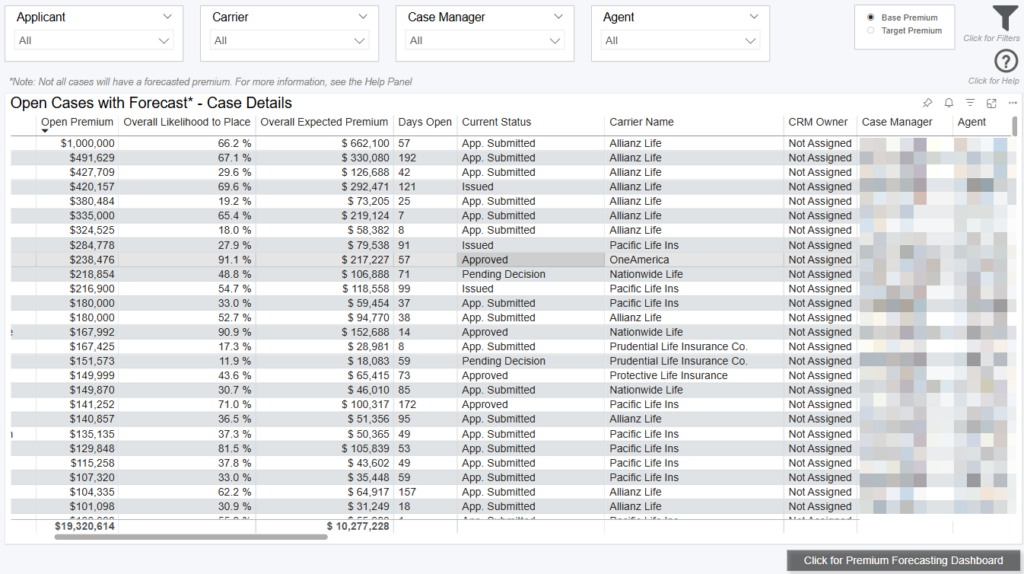
Overview
This dashboard displays forecasted premium based on all open formal cases showing their overall Likelihood To Place (LTP) and probability of placing within 15, 30, 45, 60, beyond 60 days, End of Current Month (EOCM), and End of Next Month (EONM). The Forecast can be adjusted with the “Overall Likelihood to Place” slider within the filter pane which allows you to see a more conservative or aggressive outlook on placement.
***Not all cases receive a Forecast***
This dashboard will only show open cases that have received a Forecast.
There are a variety of reasons in which a case is not scored (i.e., does not have a Forecast). The following list describes the main reasons in which a case will not receive a Forecast:
- ONLY formal cases receive a Forecast
- ONLY cases that are open longer than 200 days will no longer have a forecast
- ONLY cases that have misc. date errors such as the Placed Date being more recent that the Paid Closed Created Date
-The following types of products will not be scored: Single Premium, Viatical, Group Life, Health, Group Health, Medicare Products, Critical Illness, Group Disability, and Life Settlement
Note: This dashboard only looks at cases that have been open within the last year
Note: Click toggle in top right to switch premium by base or target; base premium uses agent entered values.
Note: By default, the Premium Forecasting dashboards look at only the Life Product Type (this can be updated in the filter pane)
Data Definitions
Expected Cases is calculated as the sum of the Likelihood to Place (LTP) score across all selected cases. For example, if there were two cases open and they had LTP scores of 40% and 80%, respectively. The Expected Cases (to place) would be 1.2 (0.80 + 0.40).
Expected Premium is calculated as the sum of the product of Likelihood to Place (LTP) score and selected premium (Base or Target) across all selected cases. For example, if there were two cases open and they had LTP scores of 40% and 80% and Base premiums of $10,000 and $100,000, respectively. The Expected Premium (to place) would be: 40% * $10,000 + 80% * $100,000 = $4,000 + $80,000 = $84,000
> 60 Days = beyond sixty days from today (excluding day sixty).
Converted from Informal = flag if a case was converted from an informal to formal case.
Converted from Informal (N/A) = still informal or pre application.
EOCM = End of Current Month. This is a dynamic date field that represents the forecasted premium for the end of the current calendar month
Note: As the number of days until the end of the month gets closer to 1, the forecasted premium will vary more
EONM = End of Next Month. This is a dynamic date field that represents the forecasted premium for the end of the next current calendar month
Filtering the Dashboard
Choose the Filter icon in the top right of the dashboard to narrow down by carrier, product, case type, agent, hierarchy, and more. Any selections from this filter pane will dynamically update all visuals on the dashboard.
Note: The date filter uses Paid, Closed, or Created date, however, when submitted cases and/or submitted premium are used it goes off Submitted date.
Exporting Data
Click the “Quick Actions” dropdown in the top right of your screen to send this information to your email. Choosing “Export” will immediately send an email with a file attachment. This email is tied to your InsureSight username.
Choosing “Schedule” will allow you to set up a recurring email to be delivered on the schedule you choose. To modify this schedule, click the “Settings” option in the far-left navigation menu under “InsureSight.”
Case Detail Report
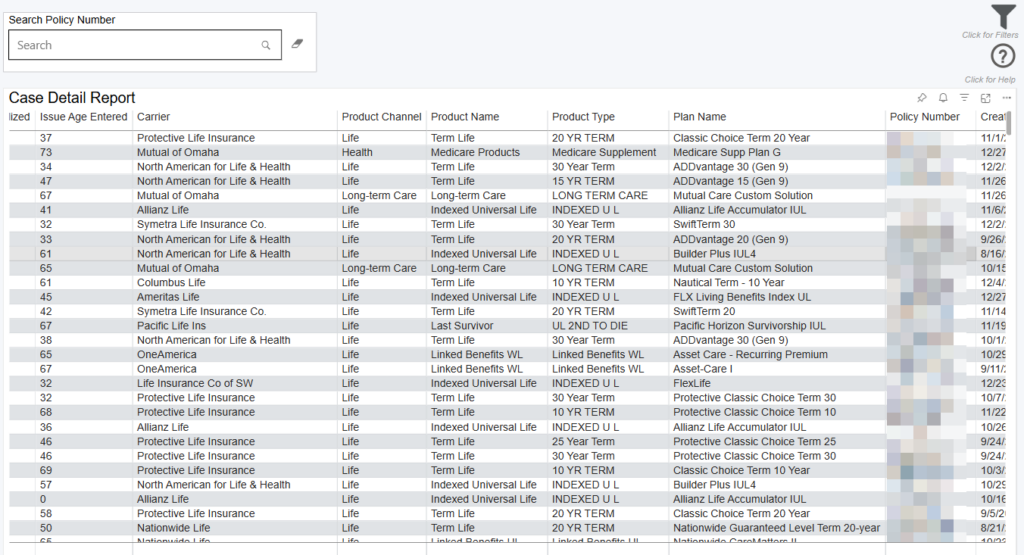
Data Definitions
Likelihood to Place = the percent chance that an open case will place. Note: this is only calculated for open cases that have been outstanding for 60 days or less and not in a current case status of Informal Application Submitted
Agency Cycle Time Normalized = Agency cycle time greater than or equal to 1 and less than or equal to 200
Carrier Cycle Time Normalized = Carrier cycle time greater than or equal to 0 and less than or equal to 200
Face Amount Normalized = face amount greater than or equal to $10,000 and less than or equal to $100,000,000
Base Premium Normalized = base premium greater than or equal to $100 and less than or equal to $10,000,000
Issue Age Normalized = issue age greater than or equal to 0 and less than or equal to 80
Entered Fields = agent entered values for cycle time, face amount, base premium, and issue age
Days Open = number of days a case has been open
Converted from Informal = flag if a case was converted from an informal to formal case
Converted from Informal (N/A) = still informal or pre application.
Activities = count of activities on a case. Note: activities started being tracked on 2/21/2020
APSs Ordered = number of APSs that were ordered on a single case
Parameds Ordered = number of Parameds that were ordered on a single case
All Status History Drilldown
Right click any row on the table and select “Drill through > All Statuses History” to see all case status history details.
Activity Report Drilldown
Right click any row on the table and select “Drill through > Activity Report Drilldown” to see all activities on a single case.
Filtering the Dashboard
Choose the Filter icon in the top right of the dashboard to narrow down by carrier, product, premium, face amount, health class, and more.
*Note: The date filter uses Paid, Closed, or Created date. Whenever Submitted cases/premium is used it goes off the Submit date.
Exporting Data
Click the “Quick Actions” dropdown in the top right of your screen to send this information to your email. Choosing “Export” will immediately send an email with a file attachment. This email is tied to your InsureSight username.
Choosing “Schedule” will allow you to set up a recurring email to be delivered on the schedule you choose. To modify this schedule, click the “Settings” option in the far-left navigation menu under “InsureSight.”