Carrier Quote Analytics
Benchmark Criteria
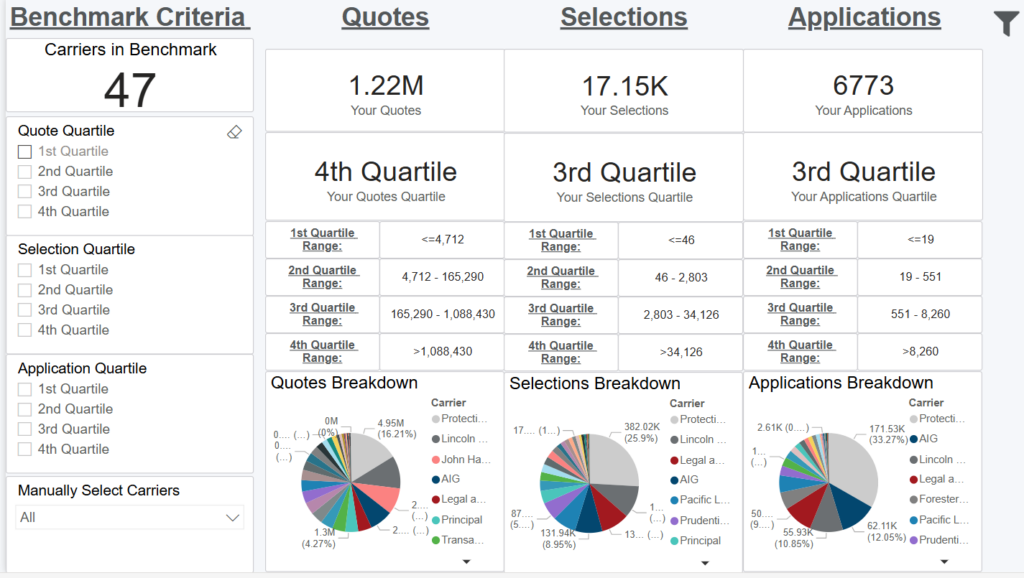
Overview
This dashboard displays the number of carriers that have products that can be quoted in iPipeline’s LifePipe and iSolve solutions. These carriers are sorted by their total number of quotes/selections/application over a rolling 12 month period and breaks the list into 4 quartiles (even segments).
For example, if there are 100 carriers in the total benchmark, the 1st quartile would be the 25 carriers with the lowest number of quotes/selections/applications over the last 12 months. The 4th quartile would be the 25 carriers with the highest number of quotes/selections/applications over the last 12 months.
Identifying Your Quartiles
On the right side of the dashboard, you can see your quotes/selections/applications over the last 12 months, the quartile you fall in and the ranges for each quartile. At the bottom, there’s a pie chart with the number of quotes/selections/application for each carrier and the percentage of the total those numbers represent.
Selecting Your Benchmark Criteria
On the left side of the dashboard are your benchmark criteria options.
The first option is to choose a quartile for quotes, selections and applications for comparison purposes.
The second criteria option is to choose one or many carriers for comparison purposes.
You can also choose to make no benchmark criteria selections on this screen, which would benchmark you against all carriers that have products that can be quoted in iPipeline’s LifePipe and iSolve solutions.
Impact of Benchmark Criteria Selection
Once set, this benchmark selection will apply to all dashboards. For example, if you choose to compare yourself to carriers in the 4th quartile for quotes, which may be 12 carriers, you will be compared to those 12 other carriers anywhere there is a “benchmark” comparison on the other dashboards. You can change these settings at any time for a different analysis.
Note: When navigating to the other dashboards, the number of carriers in the benchmark listed at the top of the page will generally reflect the number noted on the Benchmark Criteria page.
Filters
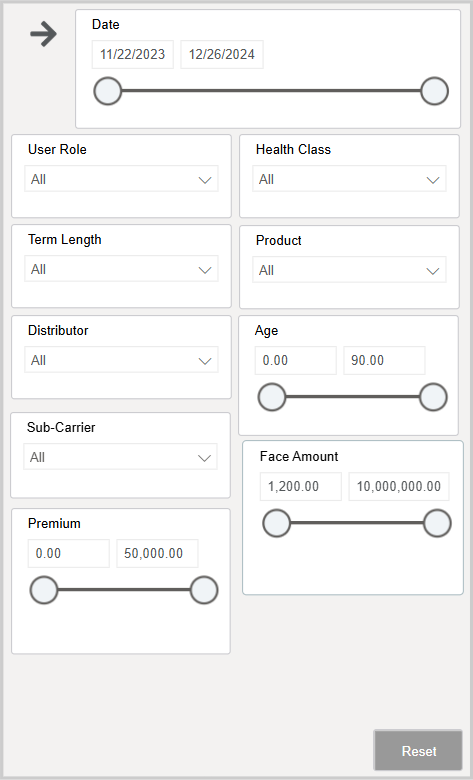
Filtering the Dashboard
Quoting Trends
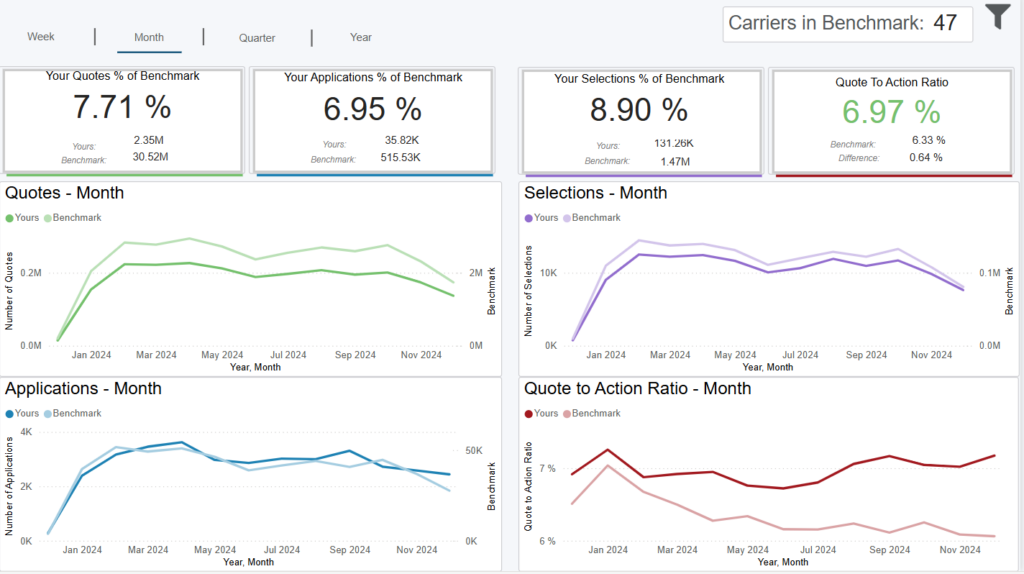
Overview
This dashboard displays several quoting metrics and how they’ve been trending over time. You can choose to see weekly, monthly, quarterly or yearly trends by clicking on one of the tabs at the top left of the screen.
The first three cards show your metric as a percentage of the overall corresponding benchmark metric. The last card compares your Quote to Action Ratio with the average Quote to Action Ratio of all carriers in the benchmark.
The four line charts are comparing your metric vs the benchmark, which is the average for all carriers in the benchmark.
Data Definitions
Quotes = number of times your products have been quoted
Selections = number of times your products have been selected for further action
Applications = number of times the agent started an application for your products
Quote to Action Ratio = (selections + applications)/quotes
Exporting Data
Click the “Quick Actions” dropdown in the top right of your screen to send this information to your email. Choosing “Export” will immediately send an email with a file attachment. This email is tied to your InsureSight username.
Choosing “Schedule” will allow you to set up a recurring email to be delivered on the schedule you choose. To modify this schedule, click the “Settings” option in the far-left navigation menu under “InsureSight.”
Pricing Trends
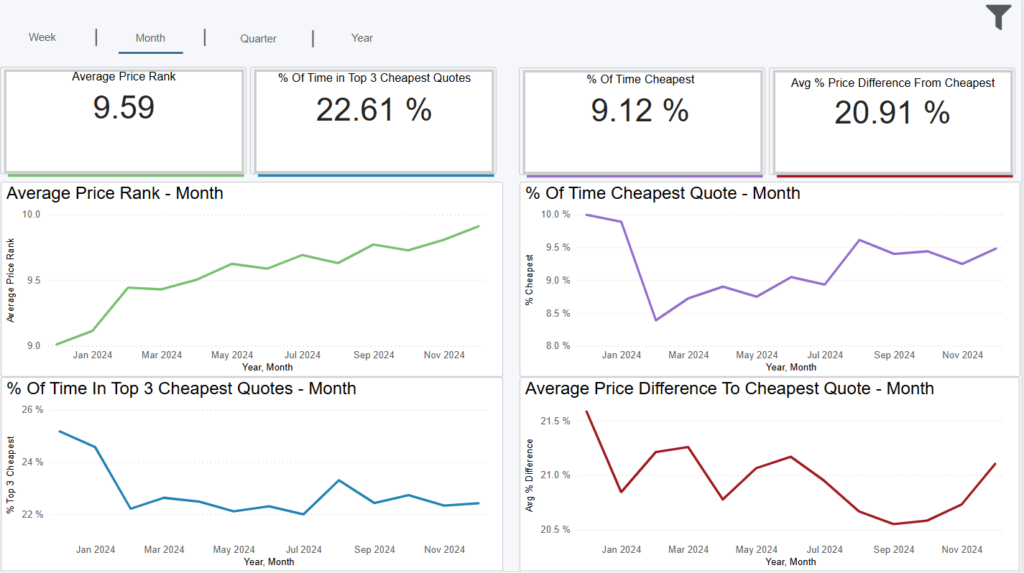
Overview
This dashboard has with several pricing metrics and how they’ve been trending over time. You can choose to see weekly, monthly, quarterly or yearly trends by clicking on one of the tabs at the top left of the screen.
Data Definitions
Average Price Rank = sum of price rank per quote/# of quotes
% of Time Cheapest Quote = # of quotes cheapest/# of quotes
% Of Time in Top 3 Cheapest Quotes = # of quotes in top 3 cheapest/# of quotes
Average Price Difference to Cheapest Quote = ((cheapest price-your price)/your price)/# of quotes
Exporting Data
Click the “Quick Actions” dropdown in the top right of your screen to send this information to your email. Choosing “Export” will immediately send an email with a file attachment. This email is tied to your InsureSight username.
Choosing “Schedule” will allow you to set up a recurring email to be delivered on the schedule you choose. To modify this schedule, click the “Settings” option in the far-left navigation menu under “InsureSight.”
Pricing Matrix – Average Price Rank
![]()
Overview
This dashboard displays your average price rank per face amount (top), age bucket (left) and term length (also left underneath the age buckets) for term products. Permanent products are in Other since they don’t have a term length.
Exporting Data
Click the “Quick Actions” dropdown in the top right of your screen to send this information to your email. Choosing “Export” will immediately send an email with a file attachment. This email is tied to your InsureSight username.
Choosing “Schedule” will allow you to set up a recurring email to be delivered on the schedule you choose. To modify this schedule, click the “Settings” option in the far-left navigation menu under “InsureSight.”
Pricing Matrix – % Difference from Best
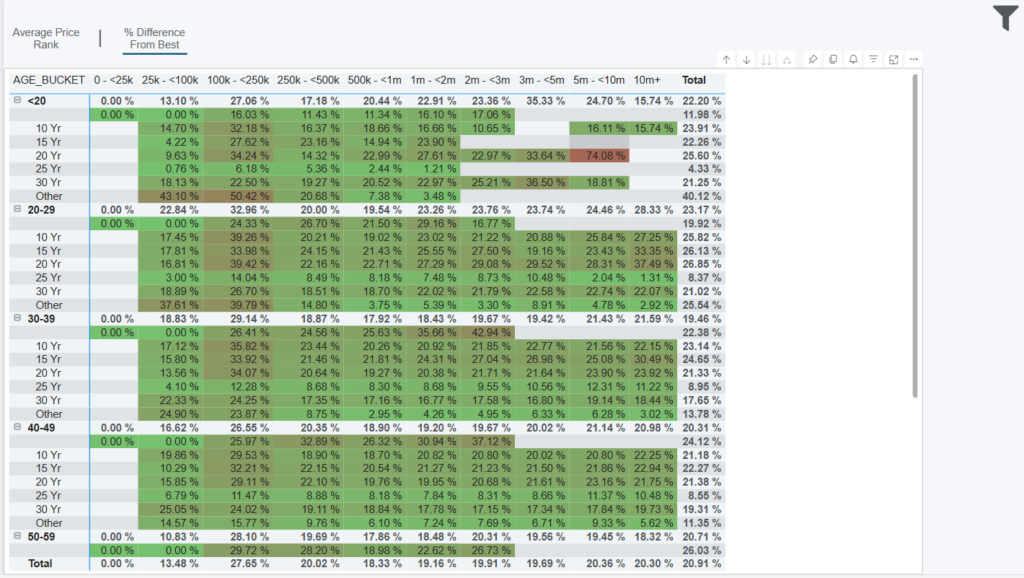
Dashboard Overview
This dashboard displays your average price rank per face amount (top), age bucket (left) and term length (also left underneath the age buckets) for term products. Permanent products are in Other since they don’t have a term length.
Exporting Data
Click the “Quick Actions” dropdown in the top right of your screen to send this information to your email. Choosing “Export” will immediately send an email with a file attachment. This email is tied to your InsureSight username.
Choosing “Schedule” will allow you to set up a recurring email to be delivered on the schedule you choose. To modify this schedule, click the “Settings” option in the far-left navigation menu under “InsureSight.”